 Picture Graphs
Typically, a Picture Graph has very broad usage. They many times used successfully in marketing, management, and manufacturing. The Picture Graphs Solution extends the capabilities of ConceptDraw DIAGRAM with templates, samples, and a library of professionally developed vector stencils for designing Picture Graphs.
 Manufacturing and Maintenance
Manufacturing and maintenance solution extends ConceptDraw DIAGRAM software with illustration samples, templates and vector stencils libraries with clip art of packaging systems, industrial vehicles, tools, resources and energy.
Pyramid Diagram

The vector stencils library "Resources and energy" contains 19 clipart images for drawing illustrations on resources and energy.
"Natural resources occur naturally within environments that exist relatively undisturbed by humanity, in a natural form. A natural resource is often characterized by amounts of biodiversity and geodiversity existent in various ecosystems.
Natural resources are derived from the environment. Some of them are essential for our survival while most are used for satisfying our wants. Natural resources may be further classified in different ways.
Natural resources are materials and components (something that can be used) that can be found within the environment. Every man-made product is composed of natural resources (at its fundamental level). A natural resource may exist as a separate entity such as fresh water, and air, as well as a living organism such as a fish, or it may exist in an alternate form which must be processed to obtain the resource such as metal ores, oil, and most forms of energy." [Natural resource. Wikipedia]
The clip art example "Resources and energy - Vector stencils library" was created in ConceptDraw PRO diagramming and vector drawing software using the Manufacturing and Maintenance solution from the Illustration area of ConceptDraw Solution Park.
Human resources

Batteries

Wind turbine

Transmission tower

Natural gas burner

Solar panel

Lightning

Ionizing radiation hazard sign

High voltage symbol

Atom

Incandescent light bulb

Oil barrels

Power station

Wood

Perpetuum mobile

Hydroelectric dam

Liquefied petroleum gas

Natural gas

Minecart with coal

Energy Pyramid Diagram

Energy Pyramid Diagram begins from the producers (plants) and proceeds through a few trophic levels of consumers (herbivores which eat these plants, the carnivores which eat these herbivores, then carnivores which eat those carnivores, and so on) to the top of the food chain.
How to Create a Scatter Chart

Chart Examples

Network wiring cable. Computer and Network Examples
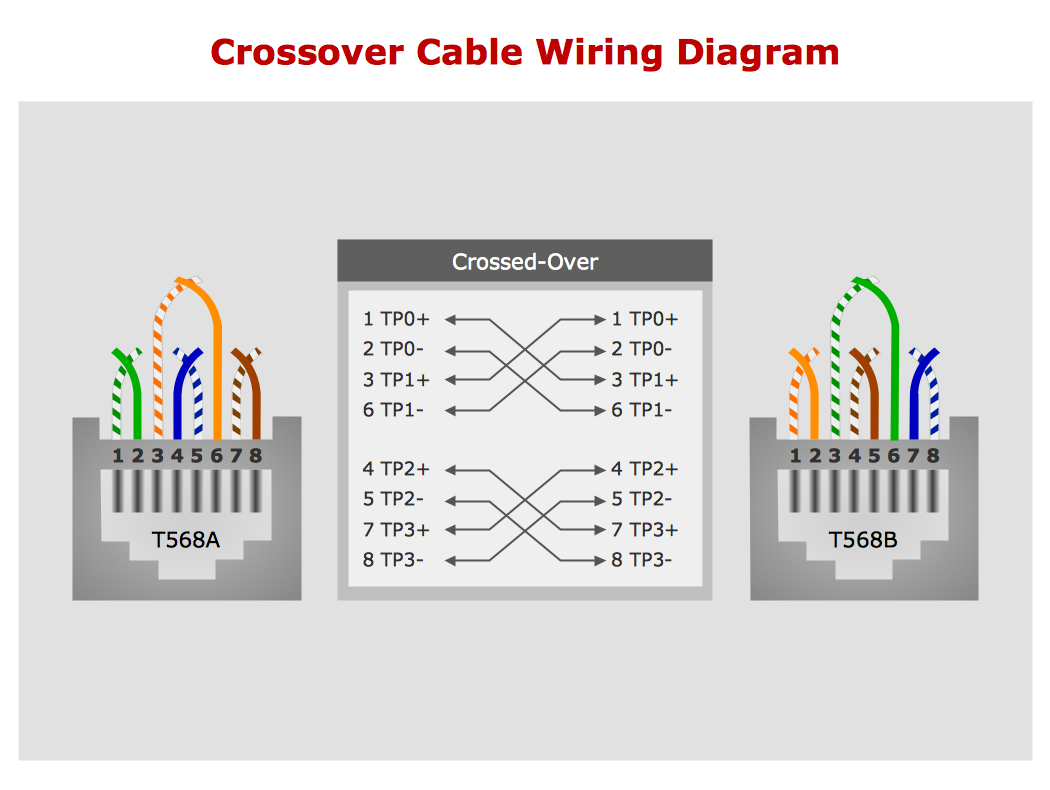
This example was created in ConceptDraw DIAGRAM using the Computer and Networks solution from the Computer and Networks area of ConceptDraw Solution Park.

Chart Templates

How To Create Home Plan with Examples


Diagram of a Pyramid

HelpDesk
How to Plan and Allocate Resources with ConceptDraw PROJECT on PC

Pyramid Charts

A Pyramid Chart has the form of triangle and hierarchically structures, organizes and help to analyze the information, data or ideas. Triangle is divided on the sections that usually have different widths. The width indicates the level of hierarchy among the topics.
Scatter Chart Examples

Use it to draw scatter graphs using ConceptDraw DIAGRAM diagramming and vector drawing software for illustrating your documents, presentations and websites.
- Natural Resource Example Pictures
- Energy And Its Resources Pie Charts Bargraph Histogram
- Resources and energy - Vector stencils library | UK Map | Hunting ...
- Resources and energy - Vector stencils library | UK Map | Computer ...
- All The Energy Resources In Histogram Pie Chart And Bar Graph
- Natural Resources Example With Image
- Project On Energy And Resource With Showing Pie Char Bar Graph
- Images Of A Energy Flow Diagram
- Resources and energy - Vector stencils library | Energy resources ...
- Chart Templates | Pie Charts | Chart Examples | Energy And Its ...
- Resources and energy - Vector stencils library | ConceptDraw ...
- Types of Flowcharts | Resources and energy - Vector stencils library ...
- Images And Drawings Of Energy Resources
- Drawing Pictures Of Energy Consumption
- Pictures Of Resources For Drawing
- Natural Resorces Example Picture
- Natural Electricity Examples Image
- Fuel Energy Photo Picture Drawing
- Solar Energy Picture With Drawing
- Conventional Energy Resources Picture
- ERD | Entity Relationship Diagrams, ERD Software for Mac and Win
- Flowchart | Basic Flowchart Symbols and Meaning
- Flowchart | Flowchart Design - Symbols, Shapes, Stencils and Icons
- Flowchart | Flow Chart Symbols
- Electrical | Electrical Drawing - Wiring and Circuits Schematics
- Flowchart | Common Flowchart Symbols
- Flowchart | Common Flowchart Symbols