How to Make a Timeline

The vector stencils library "Timelines and milestones" contains 24 shapes of time scales with start and finish dates, time interval bars with progress indication and brackets, milestone, event and today markers for drawing the timeline diagrams using the ConceptDraw PRO diagramming and vector drawing software.
"A timeline is a way of displaying a list of events in chronological order, sometimes described as a project artifact. It is typically a graphic design showing a long bar labelled with dates alongside itself and (usually) events labelled on points where they would have happened. ...
Another type of timeline is used for project management. In these cases, timelines are used to help team members to know what milestones need to be achieved and under what time schedule. For example, in the case of establishing a project timeline in the implementation phase of the life cycle of a computer system." [Timeline. Wikipedia]
The example "Design elements - Timelines solution" is included in the Timeline Diagrams solution from the Management area of ConceptDraw Solution Park.
Timeline and milestone symbols

Project Timeline

You need to make professional looking project timeline? Create it with ConceptDraw PRO! ConceptDraw PRO extended with Timeline Diagrams Solution from the Management Area is the best timeline diagrams software
Chart Templates

HelpDesk
How to Draw a Line Chart Quickly

Line Graph Charting Software

Line Graph

How to Create a Line Chart

Scatter Chart Examples

Use it to draw scatter graphs using ConceptDraw PRO diagramming and vector drawing software for illustrating your documents, presentations and websites.
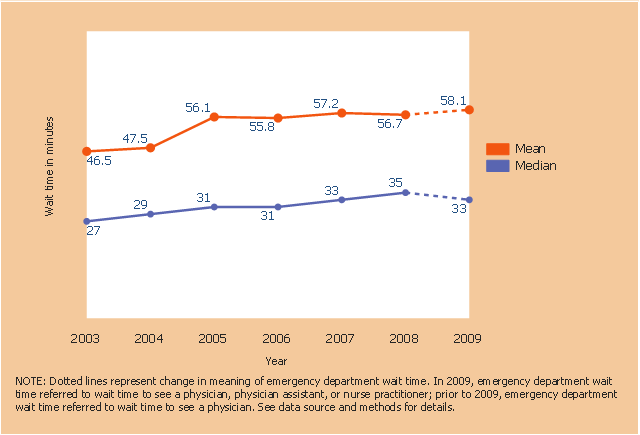
This line graph sample shows the mean and median wait time for treatment in hospital emergency department: United States, 2003–2009. Dotted lines represent change in meaning of emergency department wait time. In 2009, emergency department wait time referred to wait time to see a physician, physician assistant, or nurse practitioner; prior to 2009, emergency department wait time referred to wait time to see a physician.
This line graph was designed on the base of line graph from the website of National Center for Health Statistics, Centers for Disease Control and Prevention (CDC), U.S. Department of Health & Human Services.
[cdc.gov/ nchs/ products/ databriefs/ db102.htm]
The line chart example "Wait time for treatment in hospital emergency departments" was created using the ConceptDraw PRO diagramming and vector drawing software extended with the Line Graphs solution from the Graphs and Charts area of ConceptDraw Solution Park.
Line chart
- Sample Time Lines
- Timeline Diagrams | Examples Of Process Timelines
- Sample Ms Visio Time Line Drawing
- Timeline Diagrams | Fishbone Diagrams | Example Timelines ...
- Timeline Diagrams | Line Graphs | Basic Line Graphs | Time Line ...
- Sample Time Line
- Example Of A Timelines Indicating Key Targets And Deadlines
- Sample Timelines
- Timelines Indicating Key Target And Deadline
- Project Time Lines
- ERD | Entity Relationship Diagrams, ERD Software for Mac and Win
- Flowchart | Basic Flowchart Symbols and Meaning
- Flowchart | Flowchart Design - Symbols, Shapes, Stencils and Icons
- Flowchart | Flow Chart Symbols
- Electrical | Electrical Drawing - Wiring and Circuits Schematics
- Flowchart | Common Flowchart Symbols
- Flowchart | Common Flowchart Symbols