 Sales Dashboard
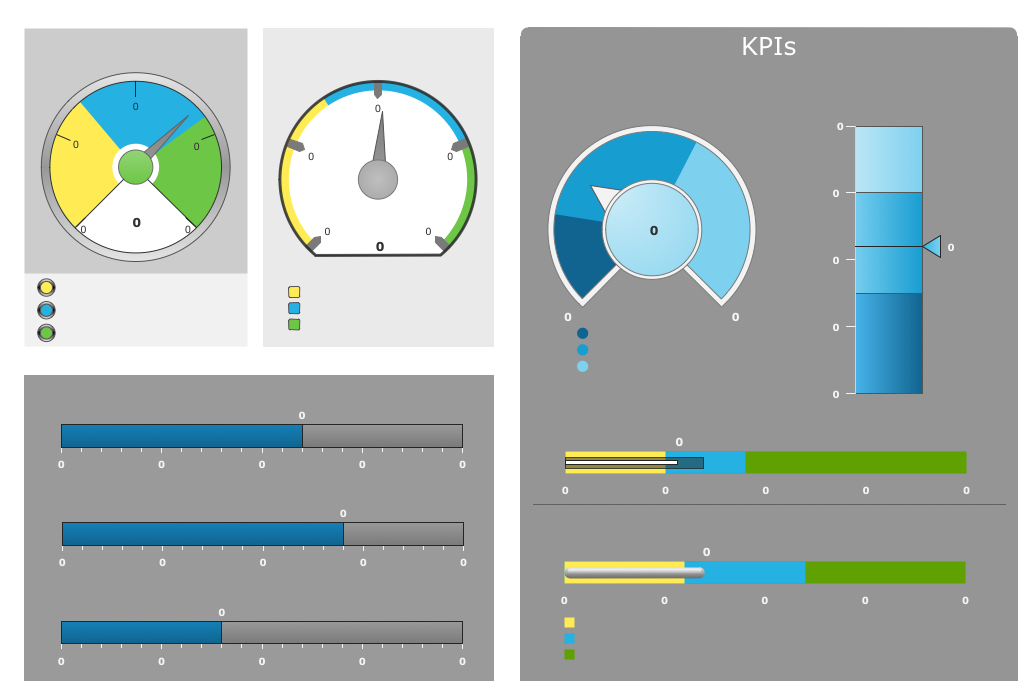
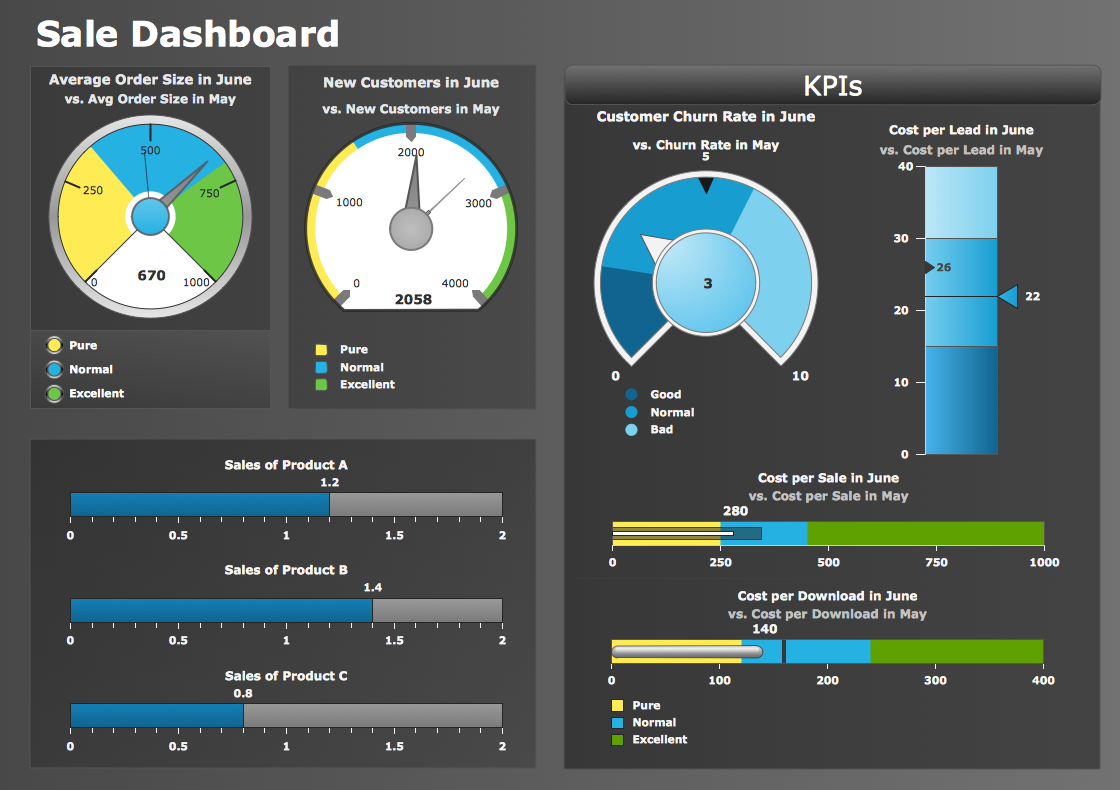
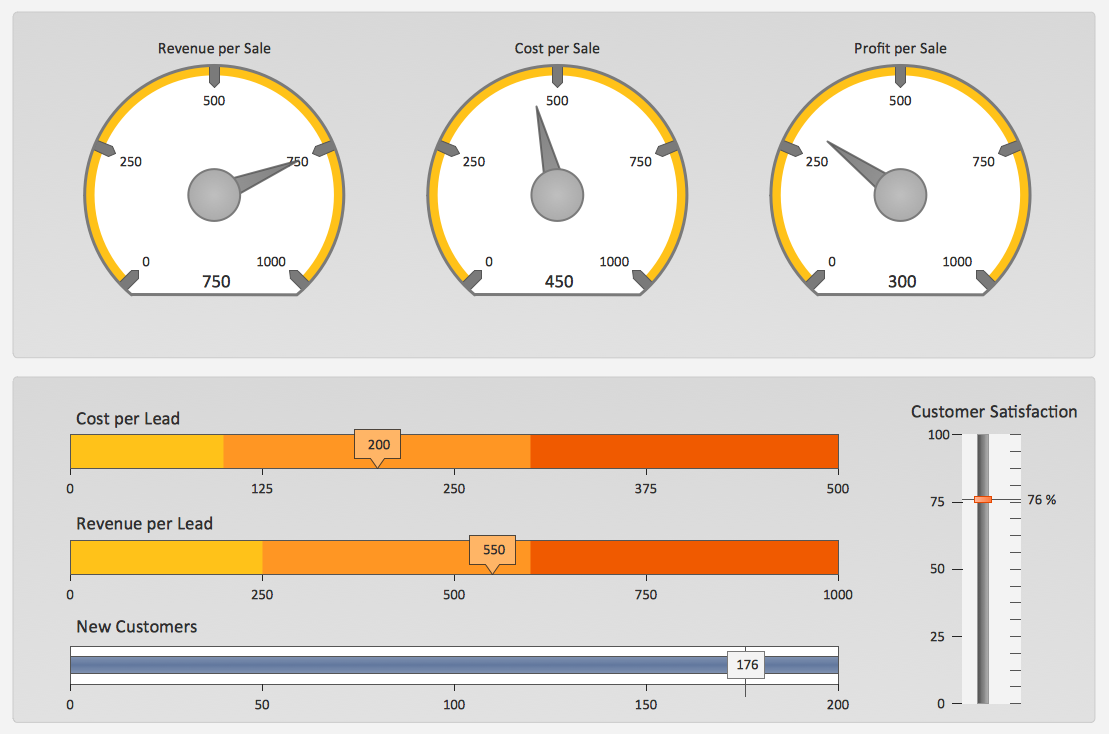
Sales Dashboard solution extends ConceptDraw DIAGRAM software with templates, samples and library of vector stencils for drawing the visual dashboards of sale metrics and key performance indicators (KPI).
Online Collaboration via Skype


 Seven Management and Planning Tools
Seven Management and Planning Tools solution extends ConceptDraw DIAGRAM and ConceptDraw MINDMAP with features, templates, samples and libraries of vector stencils for drawing management mind maps and diagrams.
Sales Dashboard Examples

 Mind Map Exchange
This solution extends ConceptDraw MINDMAP software with the ability to easily exchange mind maps with a large variety of other mind mapping applications.
Visualize Sales Data Using Sample Data

Swot Analysis Examples

Data Visualization Solutions

Empower Your Sales Team With a Sales Dashboard
Sales Dashboard Template

Sales Organization

A KPI Dashboard Provides the Answers Your Sales Team

Sales Dashboard Solutions can help your sales team keep an eye on performance

A KPI Dashboard

 Entity-Relationship Diagram (ERD)
Entity-Relationship Diagram (ERD) solution extends ConceptDraw DIAGRAM software with templates, samples and libraries of vector stencils from drawing the ER-diagrams by Chen's and crow’s foot notations.
Sales Dashboards for Your Company

Sales Performance
 Fishbone Diagram
Fishbone Diagrams solution extends ConceptDraw DIAGRAM software with templates, samples and library of vector stencils for drawing the Ishikawa diagrams for cause and effect analysis.
Sales KPI Dashboards
Data Visualization Software Solutions

- Online Collaboration via Skype | Sales Dashboard Examples ...
- Online Collaboration via Skype | Seven Management and Planning ...
- Online Collaboration via Skype | Visualize Sales Data Using Sample ...
- Marketing | How to Deliver Presentations using Mind Maps | Sales ...
- Online Collaboration via Skype | How to Collaborate in Business via ...
- Sales Dashboard - Access Anywhere | Frequency Distribution ...
- How to Collaborate in Business via Skype | Online Collaboration via ...
- How to Deliver Presentations using Mind Maps
- Pyramid Chart Examples | Pyramid Diagram | Sales Dashboard |
- Marketing | Seven Management and Planning Tools | Entity ...
- How To Create Emergency Plans | Fishbone Diagram | Create a ...
- Launch Projects Exchanging Mind Maps with Evernote | How to ...
- Swot Analysis Examples
- Restaurant Floor Plans Samples | Quality Mind Maps - samples and ...
- Seven Management and Planning Tools | Fishbone Diagram | Entity ...
- How to Collaborate in Business via Skype | Business Productivity ...
- Create Captivating Presentations Easily | How to Collaborate in ...
- Sales Dashboard Template | Sales Dashboard Examples | Sales ...
- Entity-Relationship Diagram (ERD) | Marketing | Sales Dashboard |
- Sales Dashboard - Access Anywhere | Business Intelligence ...
- ERD | Entity Relationship Diagrams, ERD Software for Mac and Win
- Flowchart | Basic Flowchart Symbols and Meaning
- Flowchart | Flowchart Design - Symbols, Shapes, Stencils and Icons
- Flowchart | Flow Chart Symbols
- Electrical | Electrical Drawing - Wiring and Circuits Schematics
- Flowchart | Common Flowchart Symbols
- Flowchart | Common Flowchart Symbols