Storage area networks (SAN). Computer and Network Examples
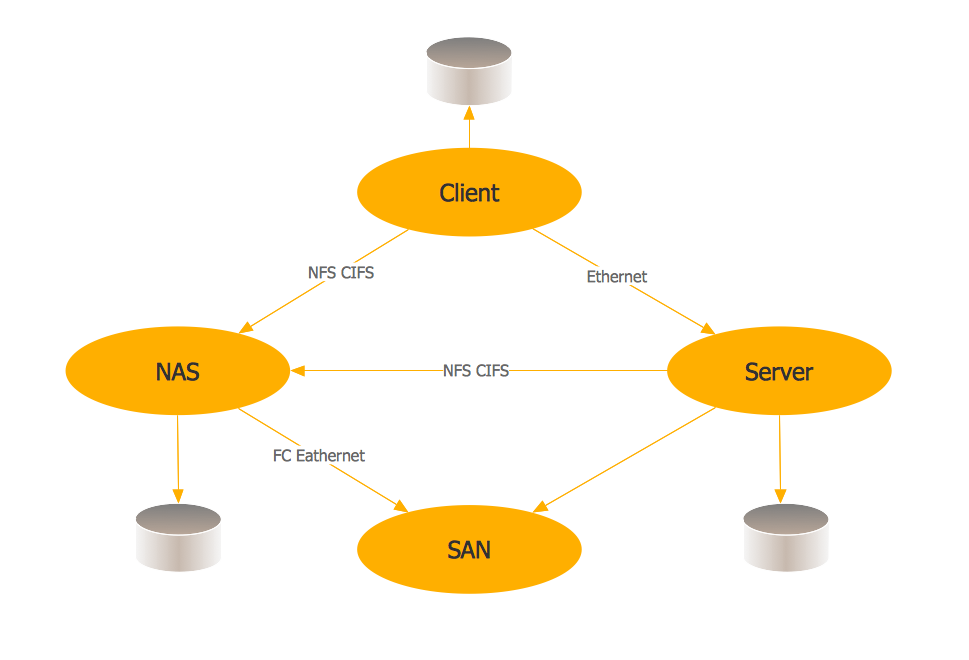
This example was created in ConceptDraw DIAGRAM using the Computer and Networks Area of ConceptDraw Solution Park. It shows the hybrid of Storage area network (SAN) and Network Attached Storage (NAS) technologies.

Internet Connectivity. Computer and Network Examples
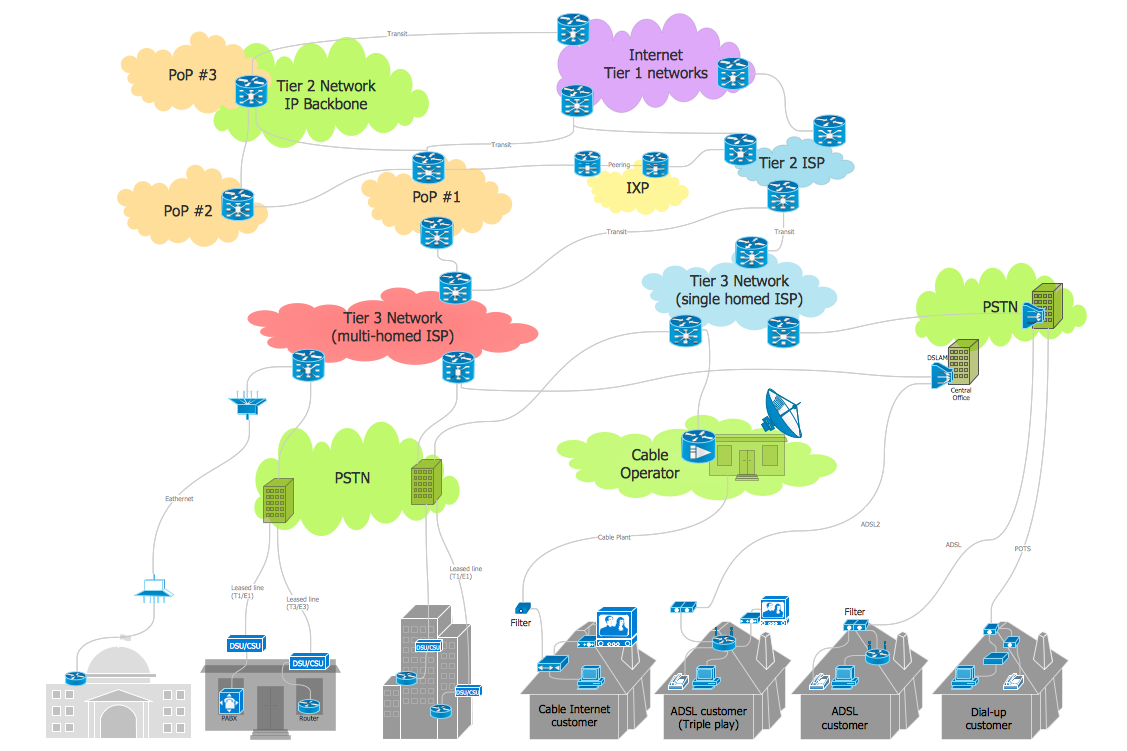
This example was created in ConceptDraw DIAGRAM using the Computer and Networks solution from the Computer and Networks area of ConceptDraw Solution Park and shows how the customers connect to ISPs and ISPs connect between the tiers (peering and transit).
Point to Point Network Topology

This sample shows the Point-to-point network topology.
Network topology is the topological structure of the computer network.
Point-to-point network topology is a simple topology that displays the network of exactly two hosts (computers, servers, switches or routers) connected with a cable. Point-to-point topology is widely used in the computer networking and computer architecture.
UML Deployment Diagram
Use ConceptDraw DIAGRAM with UML deployment diagram templates, samples and stencil library from Rapid UML solution to model the physical deployment of artifacts on nodes of your software system.

Complete Network Topology
A complete (fully connected) topology is a network topology in which there is a direct link between all pairs of nodes. In a fully connected network with n nodes, there are n(n-1)/2 direct links. Networks designed with this topology are usually very expensive to set up, but provide a high degree of reliability due to the multiple paths for data that are provided by the large number of redundant links between nodes.
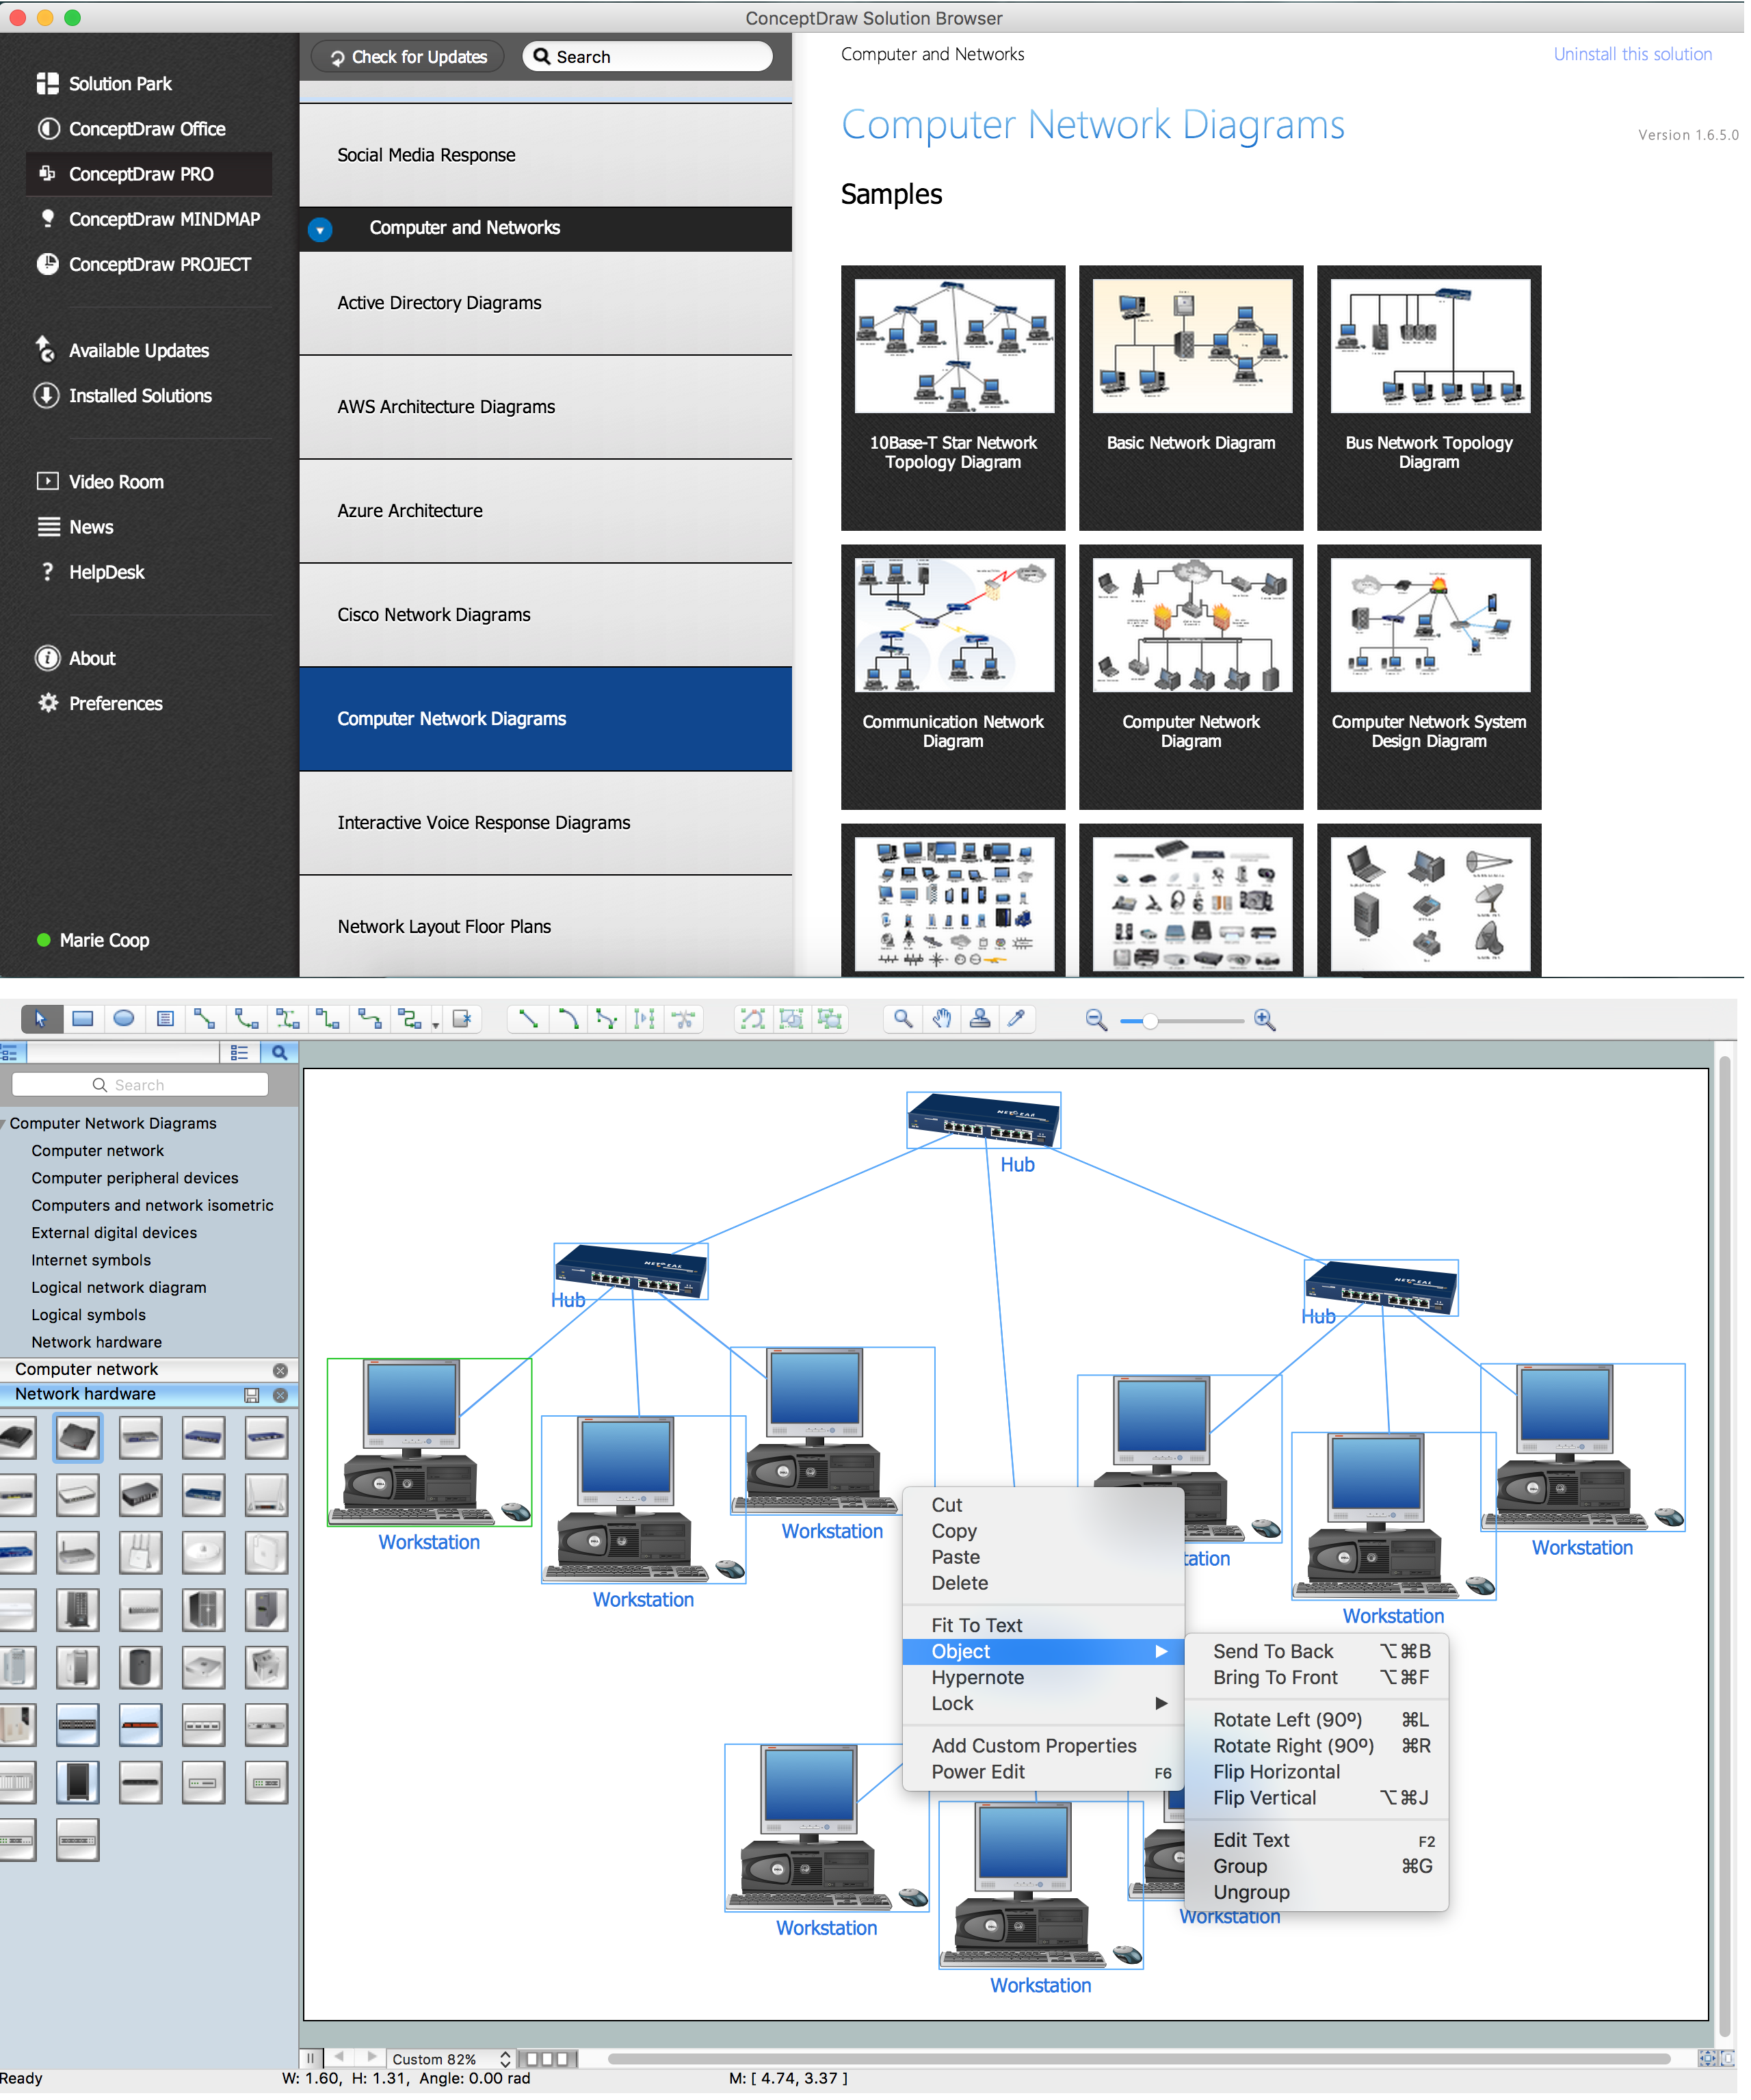
How to Create Network Diagrams
Block Diagram

Use the libraries from the Block Diagrams solution to draw block diagrams for your business documents, presentations and websites in a few minutes.
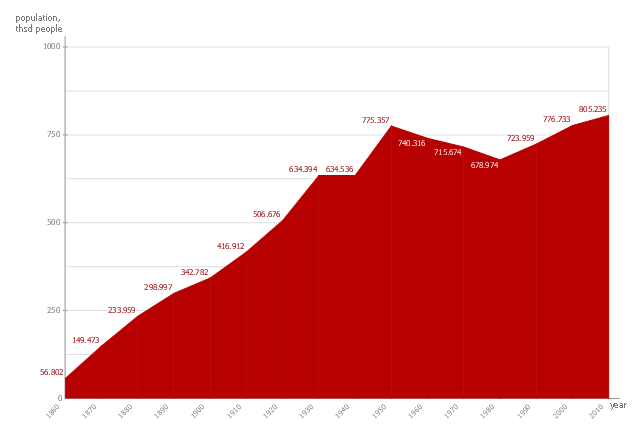
This area chart sample shows the San Francisco population changes from 1860 to 2010.
"San Francisco ..., officially the City and County of San Francisco, is the leading financial and cultural center of Northern California and the San Francisco Bay Area.
The only consolidated city-county in California, San Francisco encompasses a land area of about 46.9 square miles (121 km2) on the northern end of the San Francisco Peninsula, giving it a density of about 17,620 people per square mile (6,803 people per km2). It is the most densely settled large city (population greater than 200,000) in the state of California and the second-most densely populated major city in the United States after New York City. San Francisco is the fourth most populous city in California, after Los Angeles, San Diego and San Jose, and the 14th most populous city in the United States—with a Census-estimated 2012 population of 825,863. The city is also the financial and cultural hub of the larger San Jose-San Francisco-Oakland metropolitan area, with a population of 8.4 million." [San Francisco. Wikipedia]
The area graph example "San Francisco population history" was created using the ConceptDraw PRO diagramming and vector drawing software extended with the Area Charts solution from the Graphs and Charts area of ConceptDraw Solution Park.
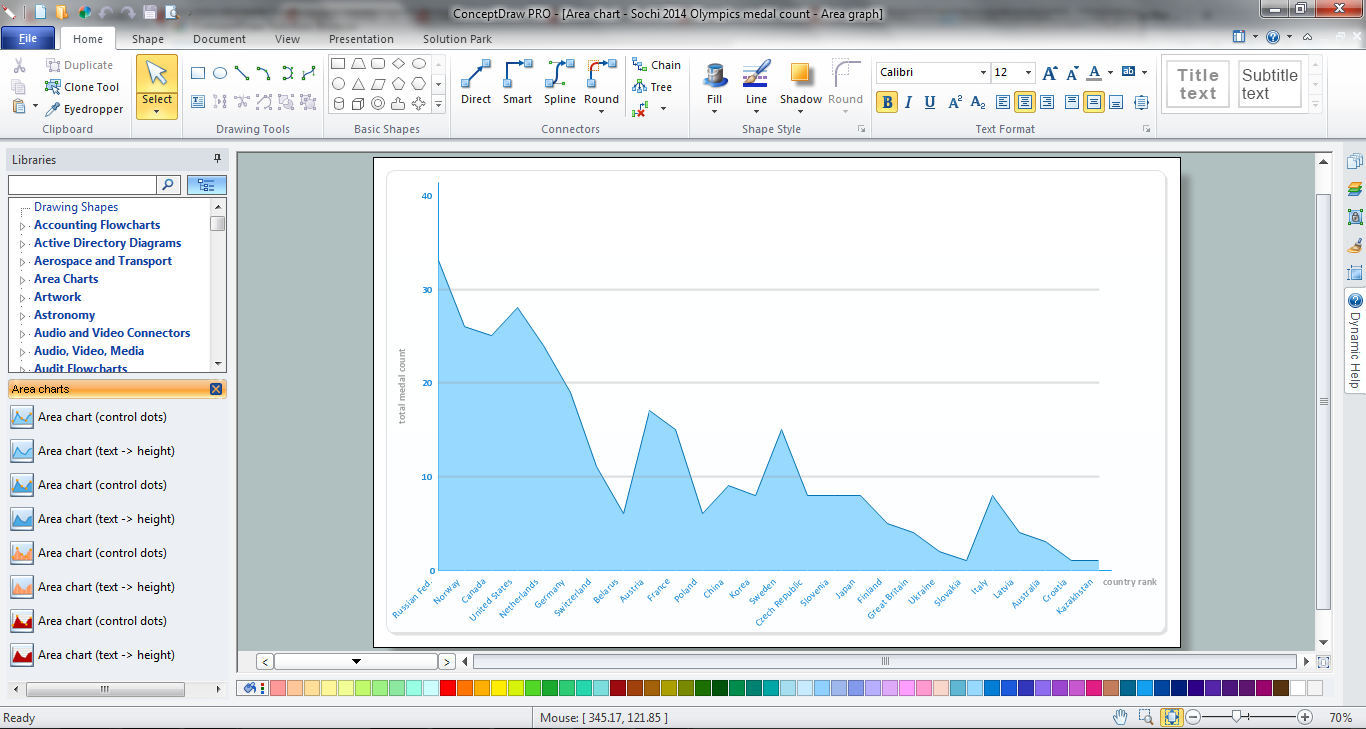
Area chart
 Basic Area Charts
This solution extends the capabilities of ConceptDraw DIAGRAM (or later) with templates, samples and a library of vector stencils for drawing Area Charts (area graphs) that visualize changes in values by filling in the area beneath the line connecting data points.
This area chart sample shows the population growth of San Francisco, California from 1850-2005. It was redesigned from the Wikimedia Commons file: San Francisco CA Population Growth.svg. [commons.wikimedia.org/ wiki/ File:San_ Francisco_ CA_ Population_ Growth.svg]
"The San Francisco Bay Area, commonly known as the Bay Area, is a populated region that surrounds the San Francisco and San Pablo estuaries in Northern California, United States. The region encompasses the major cities and metropolitan areas of San Francisco, Oakland, and San Jose, along with smaller urban and rural areas. The Bay Area's nine counties are Alameda, Contra Costa, Marin, Napa, San Francisco, San Mateo, Santa Clara, Solano, and Sonoma. Home to approximately 7.44 million people, the nine-county Bay Area contains many cities, towns, airports, and associated regional, state, and national parks, connected by a network of roads, highways, railroads, bridges, tunnels and commuter rail. The combined urban area of San Francisco and San Jose is the second largest in California (after the Greater Los Angeles area), the fifth largest in the United States, and the 56th largest urban area in the world." [San Francisco Bay Area. Wikipedia]
The area graph example "San Francisco CA Population Growth" was created using the ConceptDraw PRO diagramming and vector drawing software extended with the Area Charts solution from the Graphs and Charts area of ConceptDraw Solution Park.
Area chart

 Basketball
The Basketball Solution extends ConceptDraw DIAGRAM.5 (or later) software with samples, templates, and libraries of vector objects for drawing basketball diagrams, plays schemas, and illustrations. It can be used to make professional looking documents, pre
 Audit Flowcharts
Audit flowcharts solution extends ConceptDraw DIAGRAM software with templates, samples and library of vector stencils for drawing the audit and fiscal flow charts.
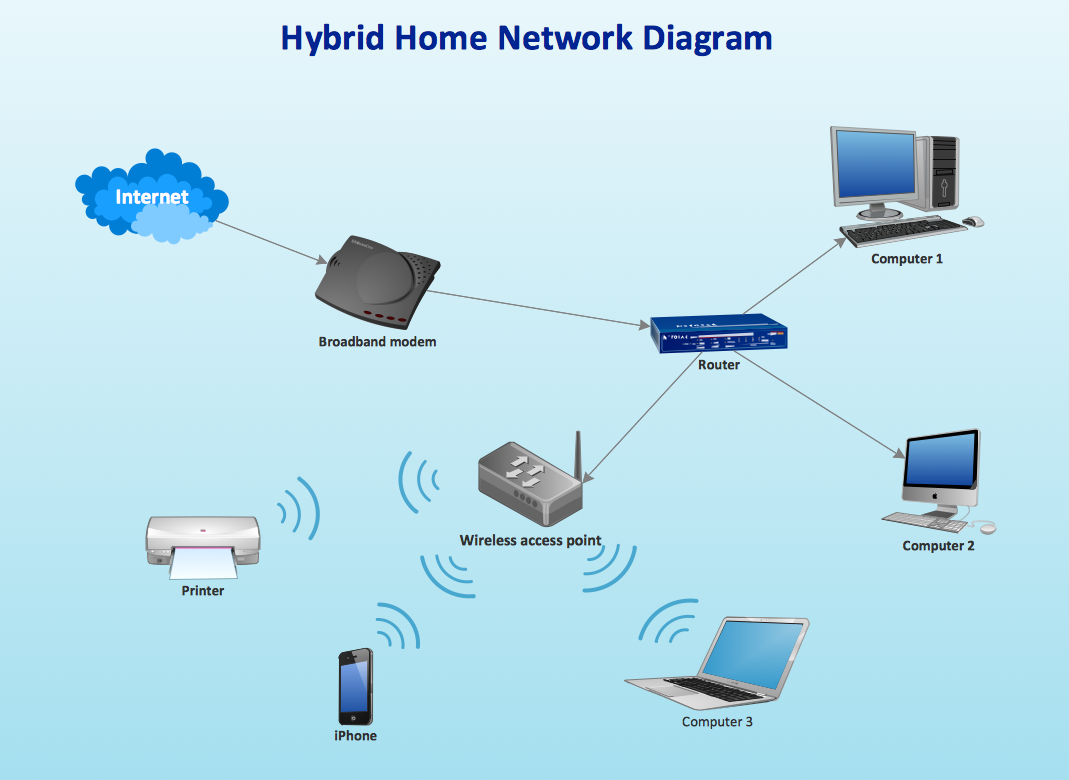
Computer Network. Computer and Network Examples
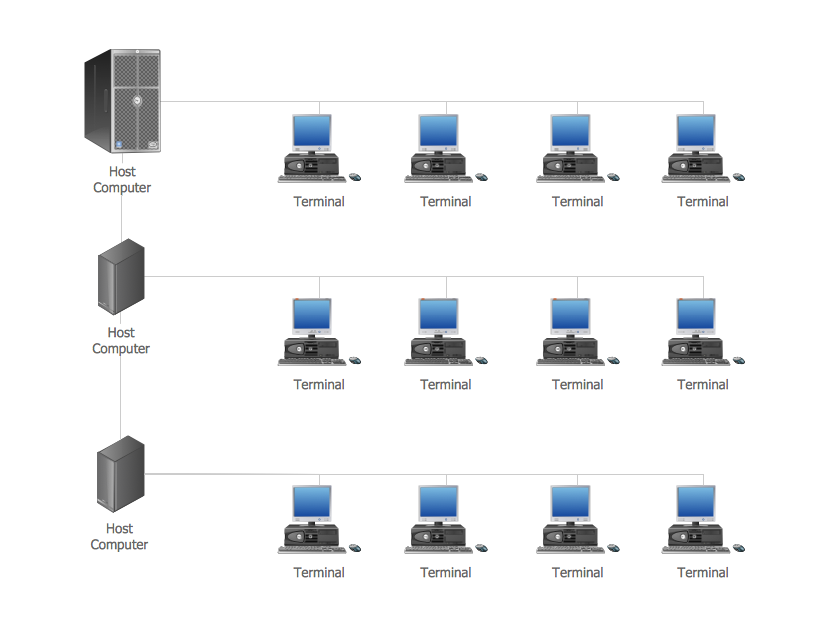
This computer network example was created in ConceptDraw DIAGRAM using the Computer and Networks Area of ConceptDraw Solution Park.
Area Chart
- Storage area networks ( SAN ). Computer and Network Examples ...
- Storage area networks ( SAN ). Computer and Network Examples ...
- Storage area networks ( SAN ). Computer and Network Examples ...
- Line Chart Examples | San Francisco population history | Regional ...
- Local area network (LAN). Computer and Network Examples ...
- Storage area networks ( SAN ). Computer and Network Examples ...
- Data Flow Diagrams | Storage area networks ( SAN ). Computer and ...
- Internet Connectivity. Computer and Network Examples | Storage ...
- CCTV Network Example | Storage area networks ( SAN ). Computer ...
- Network Security Diagrams | Storage area networks ( SAN ...
- Block Diagram | Storage area networks ( SAN ). Computer and ...
- Local area network (LAN). Computer and Network Examples | Cloud ...
- Block Diagram Creator | Storage area networks ( SAN ). Computer ...
- Metropolitan area networks (MAN). Computer and Network Examples
- Hybrid Network Topology | Storage area networks ( SAN ). Computer ...
- Line Chart Examples | Pictures of Graphs | Line Graph | Examples Of ...
- San Francisco population history - Area chart | Geo Map - USA ...
- Basic Diagramming | Line Chart Examples | Line Graph | Population ...
- Line Graph | Line Chart Examples | Pictures of Graphs | Line Graph ...
- Computer Network Architecture. Computer and Network Examples ...
- ERD | Entity Relationship Diagrams, ERD Software for Mac and Win
- Flowchart | Basic Flowchart Symbols and Meaning
- Flowchart | Flowchart Design - Symbols, Shapes, Stencils and Icons
- Flowchart | Flow Chart Symbols
- Electrical | Electrical Drawing - Wiring and Circuits Schematics
- Flowchart | Common Flowchart Symbols
- Flowchart | Common Flowchart Symbols