PROBLEM ANALYSIS. Root Cause Analysis Tree Diagram

ConceptDraw Office suite is a software for problem analysis.

 Quality Mind Map
This solution extends ConceptDraw MINDMAP software with Quality Management Mind Maps (Presentations, Meeting Agendas, Problem to be solved).
Venn Diagram Examples for Problem Solving. Computer Science. Chomsky Hierarchy

The Venn diagram example below visualizes the the class of language inclusions described by the Chomsky hierarchy.
Concept Maps

ConceptDraw PRO diagramming and vector drawing software extended with Concept Maps Solution from the "Diagrams" Area is effective tool for creating professional looking Concept Maps.
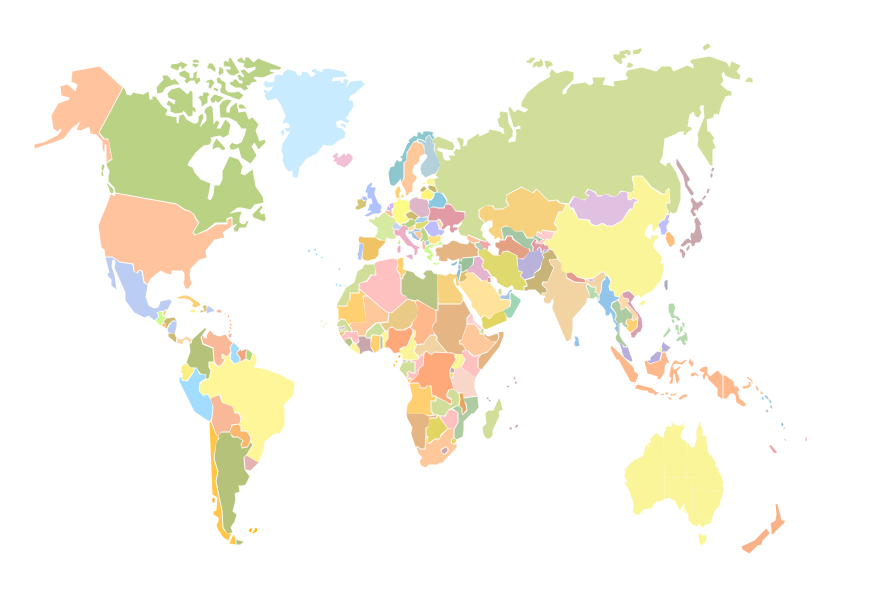
Geo Mapping Software Examples - World Map Outline
Process Flowchart


Bar Diagrams for Problem Solving. Create space science bar charts with Bar Graphs Solution

Create bar graphs for visual solving your scientific problems and data comparison using the ConceptDraw PRO diagramming and vector drawing software extended with the Bar Graphs Solution from the Graphs and Charts area of ConceptDraw Solition Park.
Quality Management Teams

Value-Stream Mapping for Manufacturing
")
Group Collaboration Software


Flow Map

ConceptDraw PRO diagramming and vector drawing software extended with Flowcharts Solution from the "Diagrams" Area of ConceptDraw Solution Park allows you to draw in a few minutes the Flow Map of any degree of complexity.
Value Stream Diagram

Mind Maps at work for Quality Managers

Communication Tool for Remote Project Management

Remote Presentation for Skype solution for ConceptDraw MINDMAP helps communicate with remote team and customers in visual manner on wide range of issues. Using this solution for regular status meetings allows you to push your team on tasks and keep task statuses up to date.
Basic Flowchart Symbols and Meaning


- Problem Solution Map Examples
- Example Of Problem Solution Map
- Examples Of Problem Solution Map
- Problem Solution Sample Templates
- Quality Mind Map | TQM Diagram Example | Fishbone Diagram ...
- Problem Solution Map
- Example Of Problem And Solution
- Mind Mapping Electrical Engineering Problem And Solution
- Quality Mind Map Solution | Lean Value Stream Map | Map Software ...
- Process Flowchart | Venn Diagram Examples for Problem Solving ...
- Quality Problems Examples
- Problem And Solution Example
- Venn Diagram Examples for Problem Solving. Environmental Social ...
- Concept Maps | Venn Diagram Examples for Problem Solving ...
- What Constitutes a Project? | PERT chart - Sale problem solution ...
- Root cause analysis tree diagram - Manufacturing problem solution ...
- Solution Map Diagram
- Process Flowchart | Venn Diagram Examples for Problem Solving ...
- Venn Diagram Examples for Problem Solving. Computer Science ...
- Mind Map Science Solutions
- ERD | Entity Relationship Diagrams, ERD Software for Mac and Win
- Flowchart | Basic Flowchart Symbols and Meaning
- Flowchart | Flowchart Design - Symbols, Shapes, Stencils and Icons
- Flowchart | Flow Chart Symbols
- Electrical | Electrical Drawing - Wiring and Circuits Schematics
- Flowchart | Common Flowchart Symbols
- Flowchart | Common Flowchart Symbols