Quality Management Tools
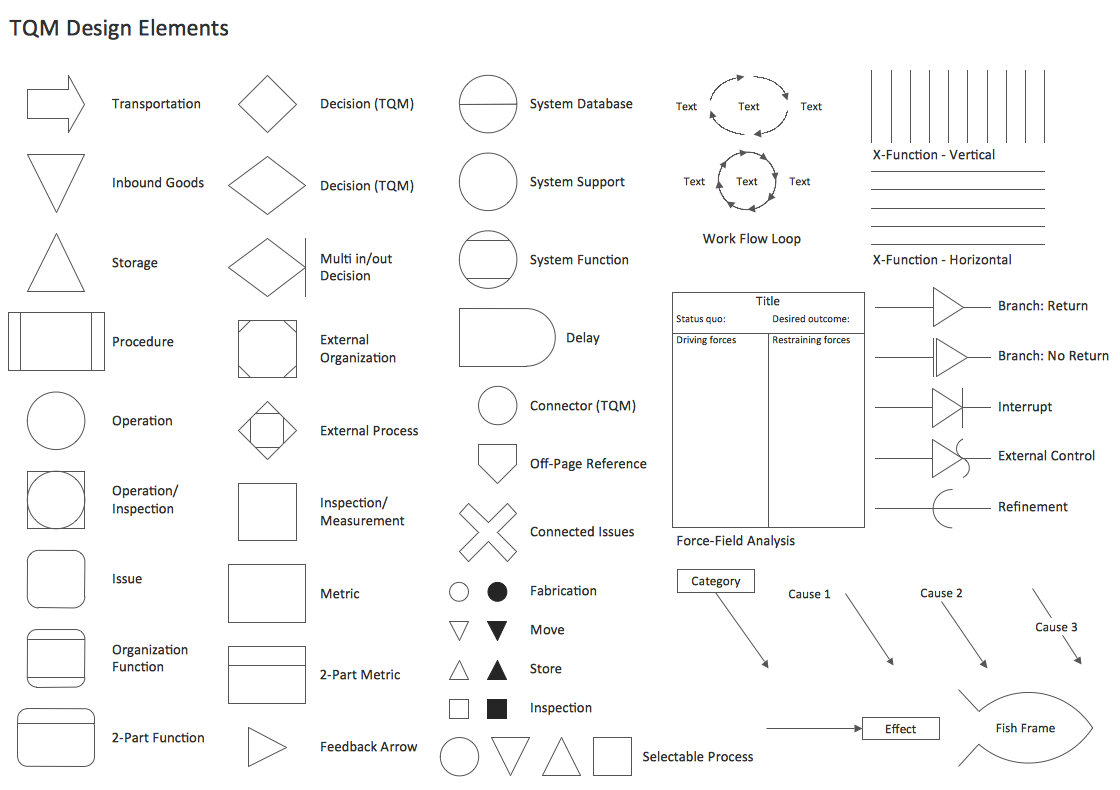
ConceptDraw PRO diagramming and vector drawing software offers at your disposal quality management tools of the Total Quality Management (TQM) Diagrams solution from the Quality area of ConceptDraw Solution Park which will help facilitate a drawing diagrams process for quality management.How To Use Collaboration Tool in Project Management
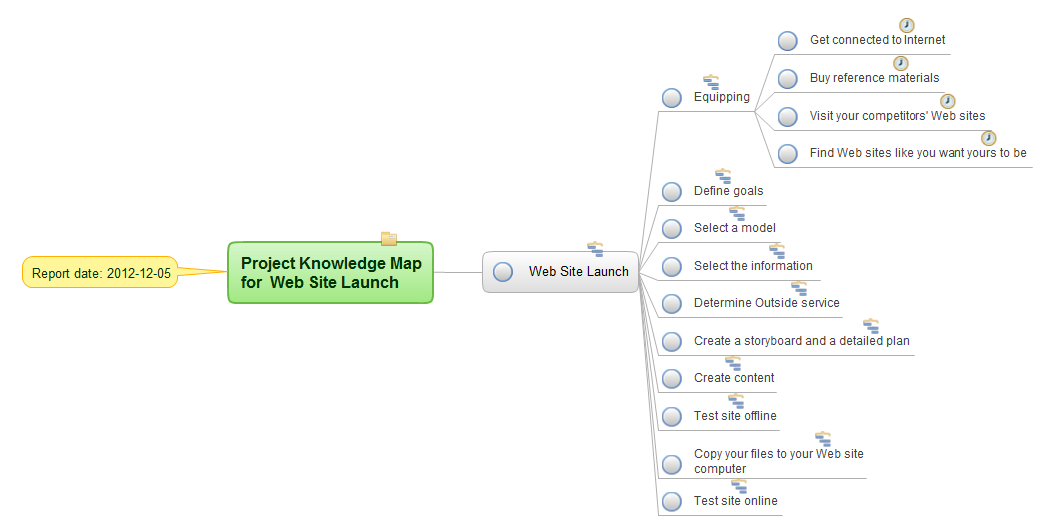
Collaboration tool for project management enables you to give a new role to knowledge management and document sharing within your team.
TQM Tools
ConceptDraw PRO diagramming and vector drawing software enhanced with Total Quality Management (TQM) Diagrams solution from the Quality area of ConceptDraw Solution Park is rich for the useful and effective TQM tools.ConceptDraw PROJECT Project Management Software Tool
ConceptDraw PROJECT is simple project management software. If you are on the fast track in your career and start facing such challenges as coordination many people, coordination tasks and works, manage project with a great deal of time and money involved - it is the right time to get Project management tool involved in your work.
 Seven Management and Planning Tools
Seven Management and Planning Tools solution extends ConceptDraw PRO and ConceptDraw MINDMAP with features, templates, samples and libraries of vector stencils for drawing management mind maps and diagrams.
7 Management & Planning Tools
The "7 Management and Planning Tools" solution implements well-known methodologies for problem analysis and solving. Different products from the ConceptDraw Office suite can be used as a complete solution for any of the methodologies in this solution. ConceptDraw Office provides visual communication during every stage of work.Property Management Examples
This sample was created in ConceptDraw PRO diagramming and vector drawing software using the Seven Management and Planning Tools Solution from the Business Productivity area of ConceptDraw Solution Park.This sample shows the Property Management matrix, the ideas are ordered in regards to importance and frequency. This matrix gives the ability to turn the theory into quantifiable data.
 Seven Basic Tools of Quality
Manage quality control in the workplace, using fishbone diagrams, flowcharts, Pareto charts and histograms, provided by the Seven Basic Tools of Quality solution.
Example of Flowchart Diagram
ConceptDraw - feature-rich flowchart software. This software includes flowchart diagram examples set. Libraries contain vector stencils that allow users to use RapidDraw technology. Users can start draw their own flowchart diagrams from existing examples by clicking on direction arrows.Business Process Reengineering Examples
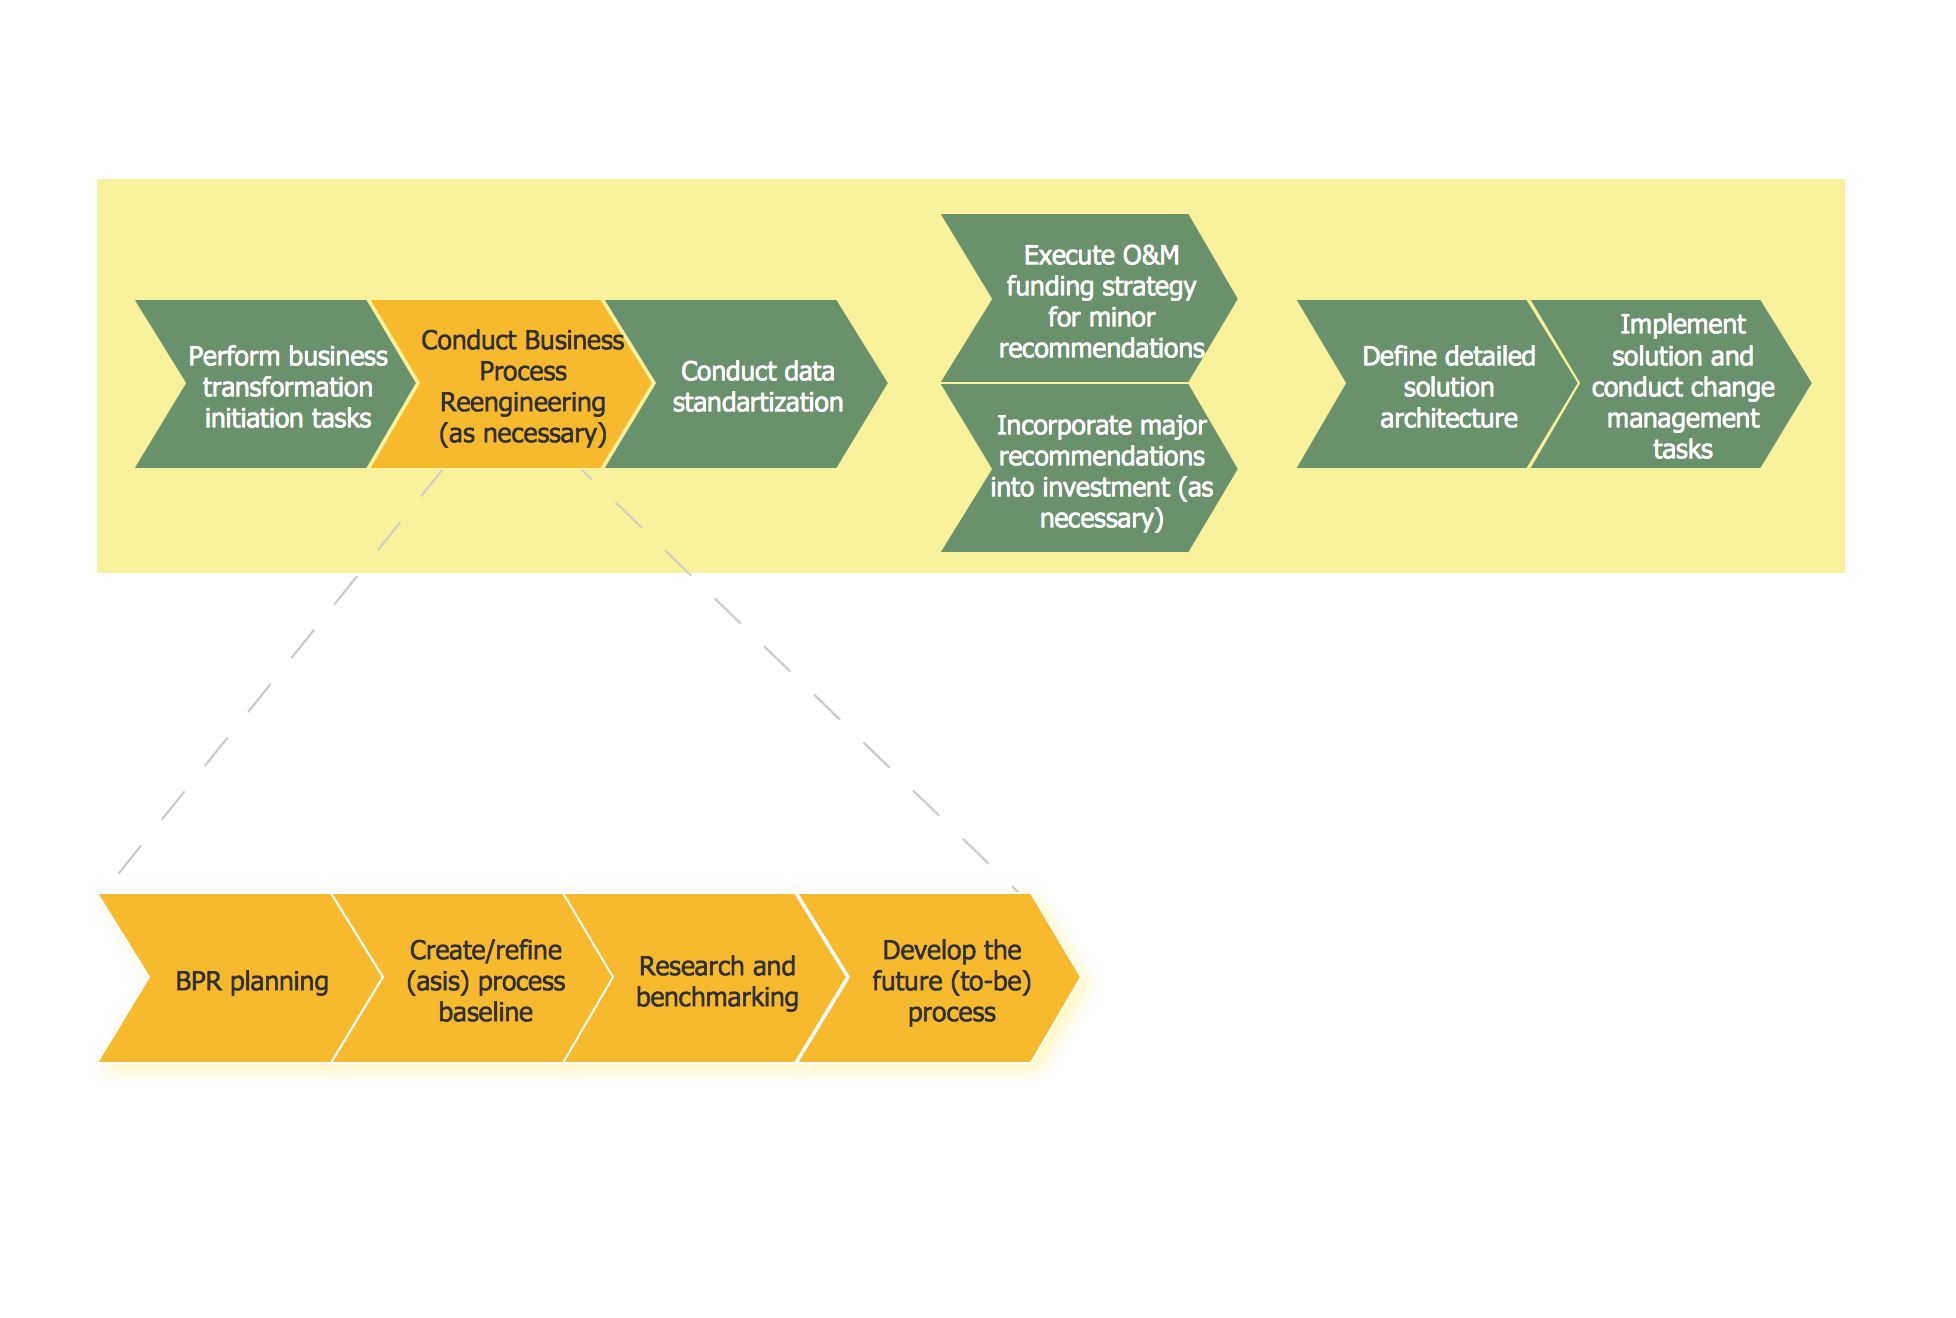
This sample shows the Business Process Reengineering Diagram. Reengineering is the process of the business processes optimizations. This sample can be used in business process management, quality management, project management and program management.PROBLEM ANALYSIS. Root Cause Analysis Tree Diagram
Root Cause Analysis Tree Diagram. Use the Root Cause Diagram to perform visual root cause analysis. Root Cause Analysis Tree Diagram is constructed separately for each highly prioritized factor. The goal of this is to find the root causes for the factor and list possible corrective action.ConceptDraw Office suite is a software for problem analysis.

Business Tools Perceptual Mapping
This sample shows the Perceptual map. It was created in ConceptDraw PRO diagramming and vector drawing software using the Matrices Solution from the Marketing area of ConceptDraw Solution Park.Perception Mapping helps organizations measure and transform all aspects of their business, people and culture. Perception Mapping allows to represent the complex relationships graphically, helps identify potential problems of the organization and make the best decisions.
Activity on Node Network Diagramming Tool
Activity on Node Network Diagramming Tool - Activity Network and Project Evaluation and Review Technique, or PERT, charts are a way of documenting and analyzing the tasks in a project.This sample shows the Activity on node network diagramming method. It was created in ConceptDraw PRO diagramming and vector drawing software using the Seven Management and Planning Tools solution from the Management area of ConceptDraw Solution Park.
Excellent Examples of Infographic Maps
Create Spatial infographics with ConceptDraw using its excellent examples of infographic maps. We hope these can inspire and teach you!How To Implement Collaborative Project Management
Collaborative Project Management via Skype is an ideal tool for project teams who need to master a growing project complexity.
- 7 New Management Tools Examples
- 7 Management And Planning Tools Examples
- Seven Management and Planning Tools | UML Class Diagram ...
- Probability Quality Control Tools | TQM Diagram Example | Total ...
- Visual Management Tools
- Daily Infographic | Infographic Examples | Management Tools | Daily ...
- Seven Management and Planning Tools | How to Manage Problem ...
- Applications Of New Seven Management Tool With Examples
- Management Tools — Total Quality Management | Create TQM ...
- Flowchart on Bank. Flowchart Examples | Management Tools ...
- Construction Project Chart Examples | Best Tool for Infographic ...
- TQM Diagram Example | Probability Quality Control Tools | TQM ...
- Explain With Example Tools Of Management Planning
- Examples Of Flowchart For Quality Plan
- Risk Management Tools Examples
- Management Tools — Total Quality Management | Identifying ...
- Decision Making | Seven Management and Planning Tools ...
- New Management Tools And Example
- 7 Tools For Quality Example
- Management Tools — Total Quality Management | Definition TQM ...
- ERD | Entity Relationship Diagrams, ERD Software for Mac and Win
- Flowchart | Basic Flowchart Symbols and Meaning
- Flowchart | Flowchart Design - Symbols, Shapes, Stencils and Icons
- Flowchart | Flow Chart Symbols
- Electrical | Electrical Drawing - Wiring and Circuits Schematics
- Flowchart | Common Flowchart Symbols
- Flowchart | Common Flowchart Symbols
-Diagram-in-SolutionBrowser.png)


