Human Resource Development

ConceptDraw PRO diagramming and vector drawing software supplied with HR Flowcharts Solution from the Management Area of ConceptDraw Solution Park can effectively help in labour-intensive process of human resource development.
Human Resources

Human Resource Management

Types of Flowchart - Overview


HR infographics "Electronic human resources (E-HR)" was redesigned from the Wikimedia Commons file: Ehr diagram.jpg. [commons.wikimedia.org/ wiki/ File:Ehr_ diagram.jpg]
This file is licensed under the Creative Commons Attribution-Share Alike 3.0 Unported license. [creativecommons.org/ licenses/ by-sa/ 3.0/ ]
"E-HR is a function of HR that is concerned with the use, management, and regulation of electronic information and processes within an organization.
E-HR is different from E-HRM (Electronic Human Resource Management) and HRIS (Human Resource Information System) which are uses of technology. More specifically, E-HRM is a system that allows management and employees access to human resource related information and services through an organization's intranet or web portal. HRIS refers to enterprise resource planning software that streamlines human resource functions such as payroll.
In contrast, E-HR is a function of human resources that requires cross-functional knowledge and collaboration between multiple departments, most notably human resources and information technology." [Electronic human resources. Wikipedia]
The HR infographics example "Electronic human resources (E-HR)" was created using the ConceptDraw PRO diagramming and vector drawing software extended with the HR Flowcharts solution from the Management area of ConceptDraw Solution Park.
HR infographics
.png--diagram-flowchart-example.png)
Used Solutions
 HR Flowcharts
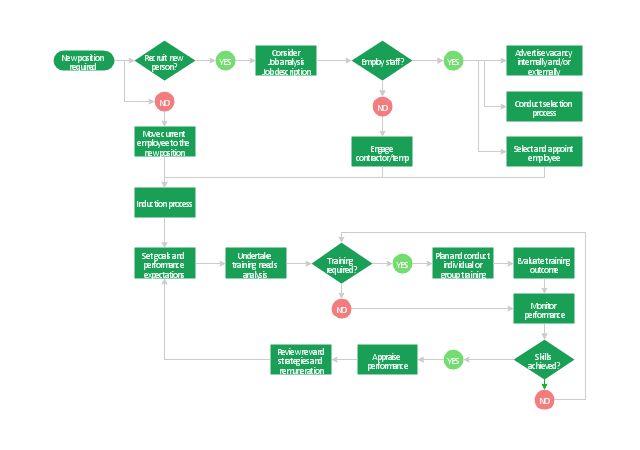
Human resource management diagrams show recruitment models, the hiring process and human resource development of human resources.
HR Flowchart Symbols

HR Management Software

The HR Management Software is an incredibly powerful tool for those who need to analyze or present human resource process flows in a visually effective manner.
Recruitment

The recruitment process often requires design and use of various HR flowcharts, diagrams, attractive illustrations. Never before their creation wasn’t so easy as now with HR Flowcharts Solution from the Management Area of ConceptDraw Solution Park.
Hiring Process

ConceptDraw PRO diagramming and vector drawing software aspires to help its users in the hiring process and offers a powerful HR Flowcharts Solution from the Management Area of ConceptDraw Solution Park.
TQM Software — Build Professional TQM Diagrams

"Human resource management (HRM, or simply HR) is the management process of an organization's workforce, or human resources. It is responsible for the attraction, selection, training, assessment, and rewarding of employees, while also overseeing organizational leadership and culture and ensuring compliance with employment and labor laws. In circumstances where employees desire and are legally authorized to hold a collective bargaining agreement, HR will also serve as the company's primary liaison with the employees' representatives (usually a trades union).
HR is a product of the human relations movement of the early 20th century, when researchers began documenting ways of creating business value through the strategic management of the workforce. The function was initially dominated by transactional work, such as payroll and benefits administration, but due to globalization, company consolidation, technological advancement, and further research, HR now focuses on strategic initiatives like mergers and acquisitions, talent management, succession planning, industrial and labor relations, and diversity and inclusion." [Human resource management. Wikipedia]
The flow chart example "HR management process" was created using the ConceptDraw PRO diagramming and vector drawing software extended with the Flowcharts solution from the area "What is a Diagram" of ConceptDraw Solution Park.
Flowchart - HR management process
This financila dashboard example was drawn on the base of the Enterprise dashboard from the Mecklenburg County Government website.
[charmeck.org/ mecklenburg/ county/ CountyManagersOffice/ OMB/ dashboards/ Pages/ Enterprise.aspx]
"In management information systems, a dashboard is "an easy to read, often single page, real-time user interface, showing a graphical presentation of the current status (snapshot) and historical trends of an organization’s key performance indicators to enable instantaneous and informed decisions to be made at a glance."
For example, a manufacturing dashboard may show key performance indicators related to productivity such as number of parts manufactured, or number of failed quality inspections per hour. Similarly, a human resources dashboard may show KPIs related to staff recruitment, retention and composition, for example number of open positions, or average days or cost per recruitment.
Types of dashboards.
Dashboard of Sustainability screen shot illustrating example dashboard layout.
Digital dashboards may be laid out to track the flows inherent in the business processes that they monitor. Graphically, users may see the high-level processes and then drill down into low level data. This level of detail is often buried deep within the corporate enterprise and otherwise unavailable to the senior executives.
Three main types of digital dashboard dominate the market today: stand alone software applications, web-browser based applications, and desktop applications also known as desktop widgets. The last are driven by a widget engine.
Specialized dashboards may track all corporate functions. Examples include human resources, recruiting, sales, operations, security, information technology, project management, customer relationship management and many more departmental dashboards.
Digital dashboard projects involve business units as the driver and the information technology department as the enabler. The success of digital dashboard projects often depends on the metrics that were chosen for monitoring. Key performance indicators, balanced scorecards, and sales performance figures are some of the content appropriate on business dashboards." [Dashboard (management information systems). Wikipedia]
The example "Enterprise dashboard" was created using the ConceptDraw PRO diagramming and vector drawing software extended with the Composition Dashboard solution from the area "What is a Dashboard" of ConceptDraw Solution Park.
Financial dashboard

Fishbone Diagram Problem Solving

To design easily the Fishbone diagram, you can use a special ConceptDraw PRO vector graphic and diagramming software which contains the powerful tools for Fishbone diagram problem solving offered by Fishbone Diagrams solution for the Management area of ConceptDraw Solution Park.
Identifying Quality Management System

- Human Resource Development | Types of Flowchart - Overview ...
- Human Resource Development | HR Flowcharts | Gant Chart in ...
- Examples Of Human Resources
- Human Resources Hiring Flowchart Example
- Fishbone Diagram Problem Solving | Human Resource ...
- Human Resource Management | Human Resources | Human ...
- Human Resources | Basic Flowchart Symbols and Meaning | Human ...
- Human Resource Dashboard Example
- Human Resources Flow Chart
- Human Resource Development | Human Resource Management ...
- SWOT Analysis | Swot Analysis Examples | Human Resource ...
- Flowchart Of Human Resource Planning
- Electronic human resources (E-HR) | Process Flowchart | UML Use ...
- Human Resource Development | Basic Flowchart Symbols and ...
- Human Resources Flow Chart Examples
- Human Resource Development | How to Plan and Allocate ...
- Human Resources Kpis Examples
- How To Create a Flow Chart in ConceptDraw | Human Resource ...
- Data Flow Diagram Human Resource Management System
- Design Elements Human Resource
- ERD | Entity Relationship Diagrams, ERD Software for Mac and Win
- Flowchart | Basic Flowchart Symbols and Meaning
- Flowchart | Flowchart Design - Symbols, Shapes, Stencils and Icons
- Flowchart | Flow Chart Symbols
- Electrical | Electrical Drawing - Wiring and Circuits Schematics
- Flowchart | Common Flowchart Symbols
- Flowchart | Common Flowchart Symbols