CORRECTIVE ACTIONS PLANNING. Risk Diagram (PDPC)


Risk Analysis
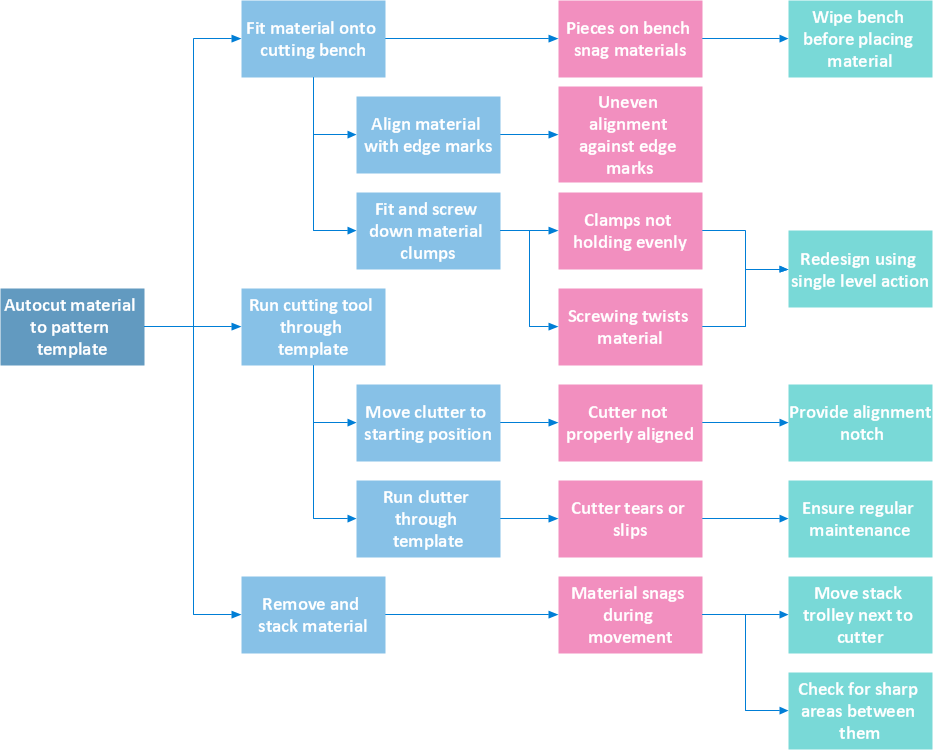
Risk Diagram (Process Decision Program Chart)

The PDPC determines the risks when corrective action is not performed correctly. Also, it helps develop descriptions for preventive actions at the level of execution.
Workflow Diagram

The workflow represents the transferring of data, documents or tasks during a work process. To make it easier to study and analyze working processes, and to present them in a simple visual manner, workflow diagrams are used. To create these diagrams professional use workflow diagram maker software ConceptDraw DIAGRAM.
The Best Flowchart Software Available

ConceptDraw DIAGRAM vector diagramming and business graphics software enhanced with with templates, green and interactive flowchart makers, samples and stencil libraries from ConceptDraw Solution Park which all focused to help with drawing flowcharts, block diagrams, bar charts, histograms, pie charts, divided bar diagrams, line graphs, area charts, scatter plots, circular arrows diagrams, Venn diagrams, bubble diagrams, concept maps, and others.

 Seven Management and Planning Tools
Seven Management and Planning Tools solution extends ConceptDraw DIAGRAM and ConceptDraw MINDMAP with features, templates, samples and libraries of vector stencils for drawing management mind maps and diagrams.
Risk Diagram (Process Decision Program Chart)

PDPC

How To Create Project Report

Sales Growth. Bar Graphs Example

- Example Of Image Chart On Business Risk
- Flow Chart Business Risk
- Diagram Of Causes Of Business Risk
- Pie Chart For Business Risks
- Sample Risk Management Plan Template Chart
- Pictures of Graphs | Business Report Pie. Pie Chart Examples ...
- Sales Growth. Bar Graphs Example | Business Report Pie. Pie Chart ...
- Concept Map On Disaster Risk
- Business Productivity Area | Seven Management and Planning ...
- Process Decision Program Chart Pdpc Examples
- ERD | Entity Relationship Diagrams, ERD Software for Mac and Win
- Flowchart | Basic Flowchart Symbols and Meaning
- Flowchart | Flowchart Design - Symbols, Shapes, Stencils and Icons
- Flowchart | Flow Chart Symbols
- Electrical | Electrical Drawing - Wiring and Circuits Schematics
- Flowchart | Common Flowchart Symbols
- Flowchart | Common Flowchart Symbols