Business Architecture
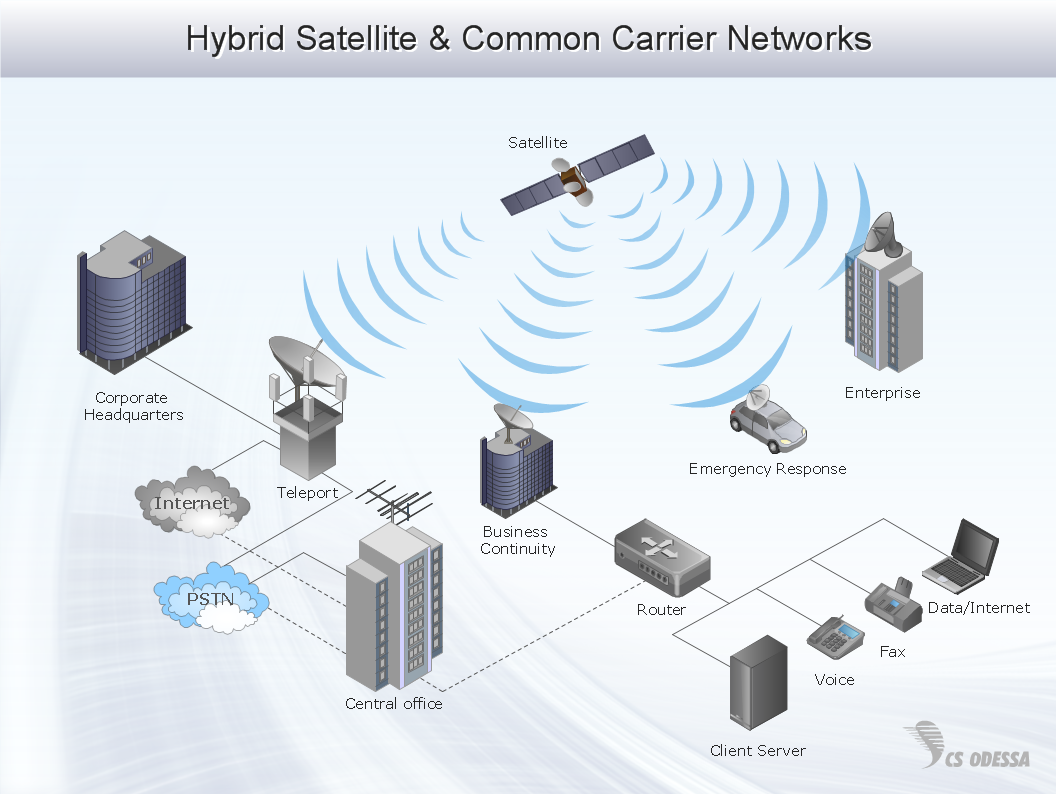
Network Diagram Software Enterprise Private Network

Data Flow Diagram Model

Business process Flow Chart — Event-Driven Process chain (EPC) diagrams

Using Fishbone Diagrams for Problem Solving

Using Fishbone Diagrams for Problem Solving is a productive and illustrative tool to identify the most important factors causing the trouble. ConceptDraw DIAGRAM extended with Fishbone Diagrams solution from the Management area of ConceptDraw Solution Park is a powerful tool for problem solving with Fishbone Ishikawa diagram graphic method.
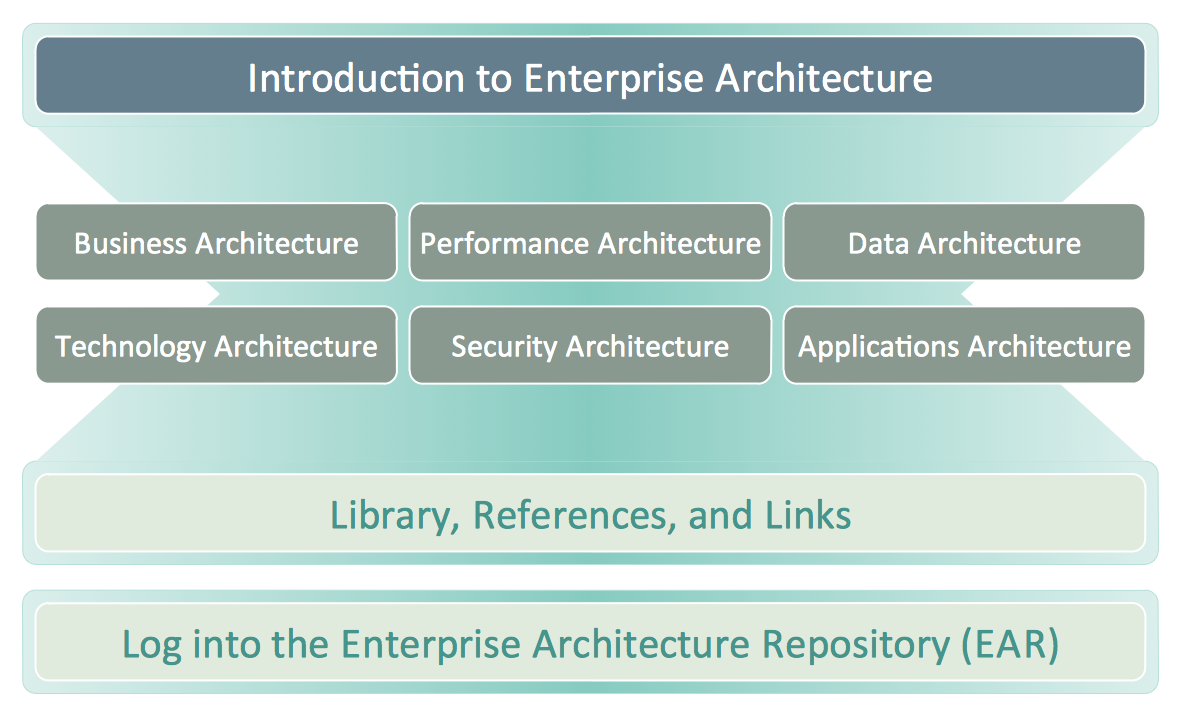
 Enterprise Architecture Diagrams
Enterprise Architecture Diagrams solution extends ConceptDraw DIAGRAM software with templates, samples and library of vector stencils for drawing the diagrams of enterprise architecture models.
Fishbone Diagram Problem Solving

To design easily the Fishbone diagram, you can use a special ConceptDraw DIAGRAM vector graphic and diagramming software which contains the powerful tools for Fishbone diagram problem solving offered by Fishbone Diagrams solution for the Management area of ConceptDraw Solution Park.
Workflow Diagram

The workflow represents the transferring of data, documents or tasks during a work process. To make it easier to study and analyze working processes, and to present them in a simple visual manner, workflow diagrams are used. To create these diagrams professional use workflow diagram maker software ConceptDraw DIAGRAM.
Data Flow Diagram Examples

EPC for Configuring an Enterprise Resource Planning

ConceptDraw DIAGRAM - software that reduces the time needed to create a business process model.
BPMN 2.0

An Event-driven Process Chain (EPC) - flowchart used for business process modelling

ConceptDraw DIAGRAM is a software for making EPC flowcharts to provide business process modelling. Its excellent business process improvement tools.
Fishbone Diagram Example

Fishbone Diagrams solution included to ConceptDraw Solution Park contains powerful drawing tools and a lot of examples, samples and templates. Each Fishbone diagram example is carefully thought-out by experts and is perfect source of inspiration for you.
Network Diagram Software. LAN Network Diagrams. Physical Office Network Diagrams

 Event-driven Process Chain Diagrams
Event-Driven Process Chain Diagrams solution extends ConceptDraw DIAGRAM functionality with event driven process chain templates, samples of EPC engineering and modeling the business processes, and a vector shape library for drawing the EPC diagrams and EPC flowcharts of any complexity. It is one of EPC IT solutions that assist the marketing experts, business specialists, engineers, educators and researchers in resources planning and improving the business processes using the EPC flowchart or EPC diagram. Use the EPC solutions tools to construct the chain of events and functions, to illustrate the structure of a business process control flow, to describe people and tasks for execution the business processes, to identify the inefficient businesses processes and measures required to make them efficient.
- Examples Of Business Enterprise Using Diagram
- Enterprise Architecture Diagrams | Business Architecture | How to ...
- Diagrams Of Business Enterprises
- Enterprise Architecture Diagrams | Information Technology ...
- Sample Diagram Of Business Enterprise Structure
- Business Architecture | Enterprise Architecture Diagrams | How to ...
- Business Model Example Diagram
- Garrett IA Diagrams with ConceptDraw PRO | Business Process ...
- Enterprise architecture domains | Enterprise architecture diagram ...
- Schematic Diagram For Business Enterprise
- Small Business Enterprise Diagram
- Business Architecture | Enterprise Architecture Diagrams | How to ...
- Enterprise Architecture Diagrams | AWS Architecture Diagrams ...
- Enterprise Architecture Diagrams | Business Architecture | IDEF ...
- Enterprise Architecture Diagrams | How to Create an Enterprise ...
- 4 Level pyramid model diagram - Information systems types ...
- Enterprise Architecture Diagrams | Fishbone Diagram Problem ...
- Flow Chart Of Small Business Enterprise
- Examples Of Business Enterprise With Drawings
- Fishbone Diagram Template | Fishbone Diagram | Fishbone ...
- ERD | Entity Relationship Diagrams, ERD Software for Mac and Win
- Flowchart | Basic Flowchart Symbols and Meaning
- Flowchart | Flowchart Design - Symbols, Shapes, Stencils and Icons
- Flowchart | Flow Chart Symbols
- Electrical | Electrical Drawing - Wiring and Circuits Schematics
- Flowchart | Common Flowchart Symbols
- Flowchart | Common Flowchart Symbols