Bar Diagrams for Problem Solving. Create event management bar charts with Bar Graphs Solution

Bar Diagrams for Problem Solving. Create space science bar charts with Bar Graphs Solution

Create bar graphs for visual solving your scientific problems and data comparison using the ConceptDraw PRO diagramming and vector drawing software extended with the Bar Graphs Solution from the Graphs and Charts area of ConceptDraw Solition Park.
 Bar Graphs
The Bar Graphs solution enhances ConceptDraw PRO v10 functionality with templates, numerous professional-looking samples, and a library of vector stencils for drawing different types of Bar Graphs, such as Simple Bar Graph, Double Bar Graph, Divided Bar Graph, Horizontal Bar Graph, Vertical Bar Graph, and Column Bar Chart.
 Event-driven Process Chain Diagrams
Event-driven Process Chain (EPC) Diagram is a type of flowchart widely used for modeling in business engineering and reengineering, business process improvement, and analysis. EPC method was developed within the Architecture of Integrated Information Systems (ARIS) framework.
 Divided Bar Diagrams
The Divided Bar Diagrams Solution extends the capabilities of ConceptDraw PRO v10 with templates, samples, and a library of vector stencils for drawing high impact and professional Divided Bar Diagrams and Graphs, Bar Diagram Math, and Stacked Graph.
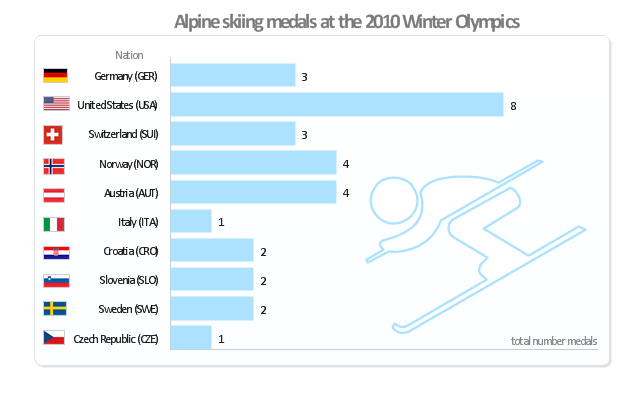
"Alpine skiing at the 2010 Winter Olympics was held at Whistler Creekside in Whistler, British Columbia, Canada. The ten events were scheduled for 13–27 February, 2010; weather delayed the first event, the men's downhill, two days until Monday, 15 February. ... Notably absent from the medals in these Olympics were the Austrian men, who had won 8 medals in 2006 and 7 in 2002. France and host Canada were shut out from the podium, as were the German men and the Swiss and Italian women. The U.S. had its best Olympics ever with eight alpine medals, only the fourth nation to achieve that total in a single Olympics (Austria, France, Switzerland). Individually, three men and five women won multiple medals; triple medalists were Bode Miller of the U.S. and Aksel Lund Svindal of Norway, who both won a medal of each color. The sole double gold medalist was Maria Riesch of Germany." [Alpine skiing at the 2010 Winter Olympics. wikipedia]
This medal bar chart example "Alpine skiing at the 2010 Winter Olympics" was created using the ConceptDraw PRO diagramming and vector drawing software extended with the Winter Sports solution.
The Winter Sports solution from the Sport area of ConceptDraw Solution Park contains the vector stencils library "Winter sports pictograms" and examples of diagrams and infographics.
Medal bar chart
 Organizational Charts
Organizational Charts solution extends ConceptDraw PRO software with samples, templates and library of vector stencils for drawing the org charts.
 Specification and Description Language (SDL)
For people in the field of systems engineering or system design, working with specification and description language (sdl) and finite state machines (fsm).
 ConceptDraw Solution Park
ConceptDraw Solution Park collects graphic extensions, examples and learning materials
 Cafe and Restaurant Floor Plans
Restaurants and cafes are popular places for recreation, relaxation, and are the scene for many impressions and memories, so their construction and design requires special attention. Restaurants must to be projected and constructed to be comfortable and e
HelpDesk
How to Draw a Pareto Chart Using ConceptDraw PRO

ConceptDraw Seven Basic Tools of Quality solution delivers a big set of vector stencil libraries and samples for each quality control diagram, including a Pareto chart.
 Composition Dashboard
Composition dashboard solution extends ConceptDraw PRO software with templates, samples and vector stencils library with charts and indicators for drawing visual dashboards showing data composition.
 Comparison Dashboard
Comparison dashboard solution extends ConceptDraw PRO software with samples, templates and vector stencils library with charts and indicators for drawing the visual dashboard comparing data.
 25 Typical Orgcharts
The 25 Typical Orgcharts solution contains powerful organizational structure and organizational management drawing tools, a variety of professionally designed organization chart and matrix organization structure samples, 25 templates based on various orga
- Bar Diagrams for Problem Solving. Create event management bar ...
- Bar Chart Examples | Bar Diagrams for Problem Solving. Create ...
- Bar Chart Examples
- Bar Diagrams for Problem Solving. Create event management bar ...
- Bar Diagrams for Problem Solving. Create event management bar ...
- Bar Chart Software | Bar Chart Examples | Bar Chart Template for ...
- PERT chart - Project management plan | Bar Diagrams for Problem ...
- Divided Bar Diagrams | Bar Graphs | Bar Diagrams for Problem ...
- Problem Solving Using Bar Charts
- Bar Diagrams for Problem Solving. Create event management bar ...
- Bar Diagrams for Problem Solving. Create space science bar charts ...
- Bar Graphs | Bar Diagrams for Problem Solving. Create event ...
- Bar Diagrams for Problem Solving. Create event management bar ...
- Sales Growth. Bar Graphs Example | Sales Dashboard | Sales ...
- Bar Diagrams for Problem Solving. Create economics and financial ...
- How to Draw a Divided Bar Chart in ConceptDraw PRO | Bar Chart ...
- An Example Of A Bar Graph Problem And Solution
- Bar Chart Examples | Bar Graphs | Bar Diagrams for Problem ...
- A Sample Diagram Of A Bar Graph
- Accounting Flowcharts | Bar Chart Examples | Bar Chart Template ...
- ERD | Entity Relationship Diagrams, ERD Software for Mac and Win
- Flowchart | Basic Flowchart Symbols and Meaning
- Flowchart | Flowchart Design - Symbols, Shapes, Stencils and Icons
- Flowchart | Flow Chart Symbols
- Electrical | Electrical Drawing - Wiring and Circuits Schematics
- Flowchart | Common Flowchart Symbols
- Flowchart | Common Flowchart Symbols