UML Class Diagram Example for Transport System

This sample shows the transport protocol mappings for SNMP (Simple Network Management Protocol), the classes of the transport system and relationships between them and is used in IP network.
UML Class Diagram Example for GoodsTransportation System

This sample shows the concept of working of the transport company and is used by transport companies, carriers at the transportation of various goods.
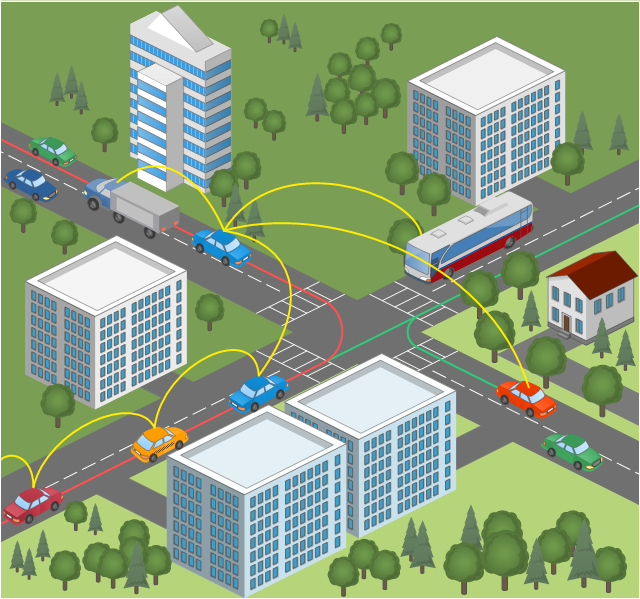
This vehicular network diagram sample was drawn on the base of picture illustrating the post "Intelligent transportation system" from the blog "Technology New Here".
"Intelligent transportation systems are projects that aim to integrate modern communication and information technology into existing transportation management systems in order to optimize vehicle life, fuel efficiency, safety, and traffic in urbanized cities.
The need for intelligent transportation systems stems from the fact that traffic congestion has been increasing all around the world because of increasing population, increasing amount of transportation vehicles and increasing urbanization."
[technologynewhere.wordpress.com/ 2010/ 05/ 12/ intelligent-transportation-system/ ]
The vehicular network diagram example "Intelligent transportation system" was created using the ConceptDraw PRO diagramming and vector drawing software extended with the Vehicular Networking solution from the Computer and Networks area of ConceptDraw Solution Park.
Vehicular network diagram
Used Solutions
JSD - Jackson system development

When implementing the Jackson System Development method and designing JSD diagrams, you can succesfully use the powerful and helpful tools of ConceptDraw DIAGRAM software extended with Entity-Relationship Diagram (ERD) solution from the Software Development area of ConceptDraw Solution Park.
Diagramming Software for Design UML Activity Diagrams


Rail transport - Design elements

Use it to draw illustrations of trains and transportation of passengers and goods by railroads.
UML Collaboration Diagram Example Illustration

This sample shows the creation process of the contact list and can be used at the staff training and staff working, at the attraction process the new clients.
Presenting Documents with Remote Presentation for Skype Solution

 Vehicular Networking
The Vehicular Networking solution extends the ConceptDraw DIAGRAM software functionality with specialized tools, wide variety of pre-made vector objects, collection of samples and templates in order to help network engineers design vehicular network diagrams for effective network engineering activity, visualize vehicular networks, develop smart transportation systems, design various types of vehicle network management diagrams, regional network diagrams, vehicular communication system diagrams, vehicular ad-hoc networks, vehicular delay-tolerant networks, and other network engineering schemes.
UML Component Diagram

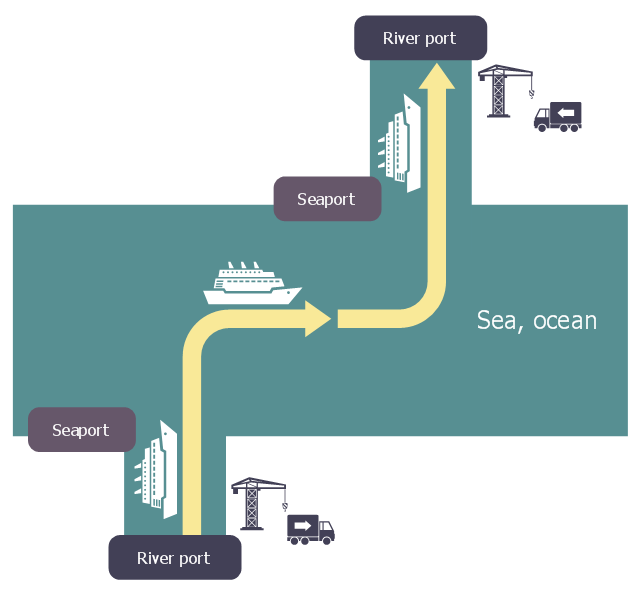
This logistic flow chart sample shows a chain of intermodal transport to link fluvio-maritime.
It was designed on the base of the Wikimedia Commons file: Logistique fluvio-maritime.jpg.
[commons.wikimedia.org/ wiki/ File:Logistique_ fluvio-maritime.jpg]
This file is licensed under the Creative Commons Attribution-Share Alike 3.0 Unported license. [creativecommons.org/ licenses/ by-sa/ 3.0/ deed.en]
"Intermodal freight transport involves the transportation of freight in an intermodal container or vehicle, using multiple modes of transportation (rail, ship, and truck), without any handling of the freight itself when changing modes. The method reduces cargo handling, and so improves security, reduces damage and loss, and allows freight to be transported faster. Reduced costs over road trucking is the key benefit for inter-continental use. This may be offset by reduced timings for road transport over shorter distances." [Intermodal freight transport. Wikipedia]
The logistic flowchart example "Intermodal transport chain" was created using ConceptDraw PRO diagramming and vector drawing software extended with the Logistics Flow Charts solution from the Business Processes area of ConceptDraw Solution Park.
Logistic flowchart
How To Create a Workflow Diagram

The fastest way to create a workflow diagram is using pre-designed workflow template. ConceptDraw DIAGRAM with the Workflow Diagrams solution delivers rich set of workflow diagram templates you may start from.
Credit Card Processing System UML Diagram

Simple & Fast Diagram Software

ConceptDraw Arrows10 Technology - This is so easy and fast to draw any type of diagram with any degree of complexity.

Jacobson Use Cases Diagram

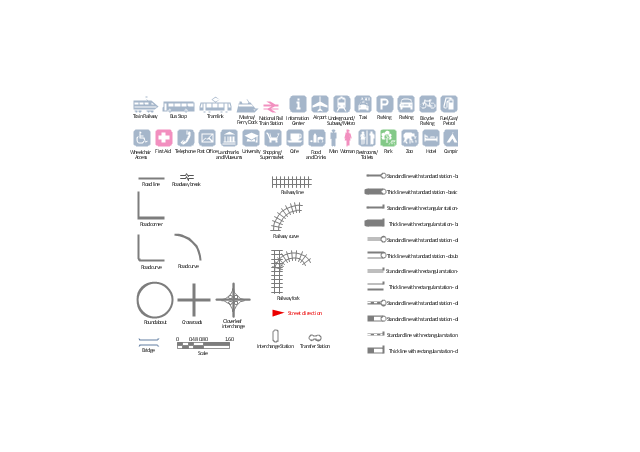
The vector stencils library "Transport map" contains 96 signs and pictograms for drawing road and transit maps.
"A transit map is a topological map in the form of a schematic diagram used to illustrate the routes and stations within a public transport system - whether this be bus lines, tramways, rapid transit, commuter rail or ferry routes. The main components are color coded lines to indicate each line or service, with named icons to indicate stations or stops.
Transit maps can be found in the transit vehicles, at the platforms or in printed timetables. Their primary function is to help users to efficiently use the public transport system, including which stations function as interchange between lines. Unlike conventional maps, transit maps are usually not geographically accurate - instead they use straight lines and fixed angles, and often illustrate a fixed distance between stations, compressing those in the outer area of the system and expanding those close to the center." [Transit map. Wikipedia]
The pictograms example "Design elements - Transport map" was created using the ConceptDraw PRO diagramming and vector drawing software extended with the Spatial Infographics solution from the Maps area of ConceptDraw Solution Park.
Transport map pictograms
Visualize Stakeholder Analysis

Use the ConceptDraw DIAGRAM diagramming and vector drawing software enhanced with powerful tools of Stakeholder Onion Diagrams Solution from the Management Area of ConceptDraw Solution Park to easy and effectively visualize stakeholder analysis.
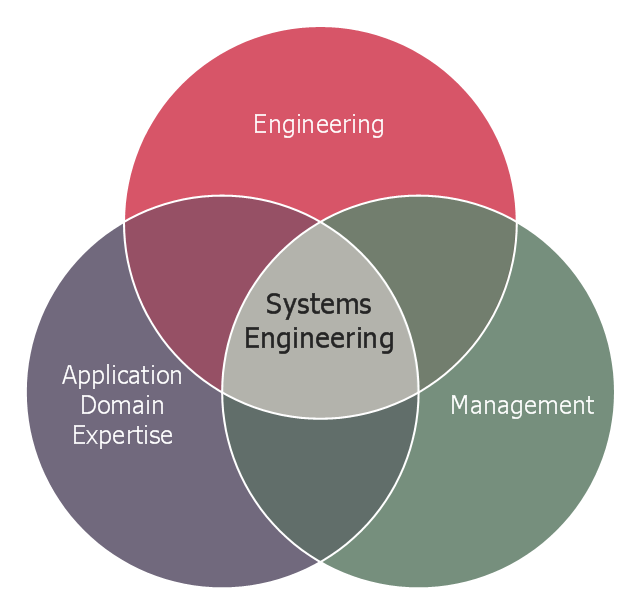
This Venn diagram sample shows the system engineering at the intersection of enginnering, management, and application domain expertise. It was designed on the base of the Venn diagram on the webpage "Intelligent Transportation Systems (ITS) ePrimer, Module 2: Systems Engineering" from the website of the Office of the Assistant Secretary for Research and Technology (OST-R), the U.S. Department of Transportation (US DOT).
"The term interdisciplinary is a fundamental concept in systems engineering. To successfully develop a system requires the application of basic engineering discipline, management discipline, and expertise in the application domain of the system. In the case of ITS, that application domain is transportation engineering. The intersection of these disciplines is the realm of systems engineering."
[pcb.its.dot.gov/ eprimer/ module2.aspx]
The Venn diagram example "Systems engineering improvement" was created using the ConceptDraw PRO diagramming and vector drawing software extended with the Venn Diagrams solution from the area "What is a Diagram" of ConceptDraw Solution Park.
Venn diagram
Flow chart Example. Warehouse Flowchart

Standard warehousing process flow diagram and standard workflow diagram used for process identification for further evaluating effectiveness and profitability of overall business process. Use the ConceptDraw DIAGRAM diagramming and vector drawing software extended with the Flowcharts solution from the Diagrams area of ConceptDraw Solution Park to design your own workflow diagrams, process flow diagram and flow charts. Need to use Process Flow Diagram for designing Warehouse packages flow.
Metro Map

The Metro Map Solution from the Maps Area uses two ConceptDraw techniques: Replicating Objects and Switching Objects. And the result is a vector graphic document.
- Example Of Use Case Diagram In Transportation System
- UML Class Diagram Example for Transport System
- Dfd For Transport System
- UML Class Diagram Example for Transport System | Flow chart ...
- Intelligent transportation system | Vehicular Networking | Systems ...
- UML Class Diagram Example for Transport System | Flowchart ...
- UML Class Diagram Example for Transport System | Brilliant ...
- UML Class Diagram Example for Transport System | Design ...
- Road Transport - Design Elements | Aerospace and Transport ...
- Class Diagram For Transport System Bus Depo
- Transportation System In Database System Er Diagram
- UML Class Diagram Example for GoodsTransportation System ...
- UML Class Diagram Example for GoodsTransportation System ...
- Transportation Infographics | Intelligent transportation system | Road ...
- UML Deployment Diagram Example - ATM System UML diagrams ...
- UML Class Diagram Example for Transport System
- UML Class Diagram Example for Transport System | UML Class ...
- Logistics Flow Charts | Intermodal transport chain | Mode Of ...
- Intelligent transportation system | Fault Tree Analysis Diagrams ...
- Flow chart Example . Warehouse Flowchart | UML Class Diagram ...
- ERD | Entity Relationship Diagrams, ERD Software for Mac and Win
- Flowchart | Basic Flowchart Symbols and Meaning
- Flowchart | Flowchart Design - Symbols, Shapes, Stencils and Icons
- Flowchart | Flow Chart Symbols
- Electrical | Electrical Drawing - Wiring and Circuits Schematics
- Flowchart | Common Flowchart Symbols
- Flowchart | Common Flowchart Symbols