Sales Process Flowchart Symbols

The vector stencils library "Sales KPIs and Metrics" contains 15 chart templates and graphic indicators of sales key performance indicators (KPIs) and metrics for drawing sales dashboards: line charts "Cost per order" and "Clicks from Sales Follow-Up Emails", column charts "Social Media Usage" and "Usage Rate of Marketing Collateral", horizontal bar charts "Rate of Follow Up Contact", "Cost per customer" and "Lead Response Time", pie charts "Product mix", "Product Performance" and "Rate of Contact", gauge (speedometer) indicators "Sales Growth" and "Actual vs Plan", bullet indicator "Sales Target", diamond alarm indicators "Average Purchase Value", "Quote to Close Ratio", "Opportunity-to-Win Ratio" and "Sales Ratio".
The dashboard charts and indicators example "Design elements - Sales KPIs and metrics" for the ConceptDraw PRO diagramming and vector drawing software is included in the Sales Dashboard solution from the Marketing area of ConceptDraw Solution Park.
www.conceptdraw.com/ solution-park/ marketing-sales-dashboard
Sales dashboard charts and graphic indicators

Amazon Web Services Diagrams diagramming tool for architecture

 Azure Architecture
Azure Architecture solution bundles into one handy tool everything you need to create effective Azure Architecture diagrams. It adds the extra value to versatile ConceptDraw DIAGRAM software and extends the users capabilities with comprehensive collection of Microsoft Azure themed graphics, logos, preset templates, wide array of predesigned vector symbols that covers the subjects such as Azure management, Azure storage, and Azure services, amongst others, and allow you to illustrate Azure Architecture diagrams at any degree of complexity, to present visually your Azure cloud system architecture with professional style, to design Azure cloud topology, to document Windows Azure Architecture and Azure Cloud System Architecture, to visualize the great abilities and work of Microsoft Azure Cloud System and Azure services.
Diagramming tool - Amazon Web Services and Cloud Computing Diagrams
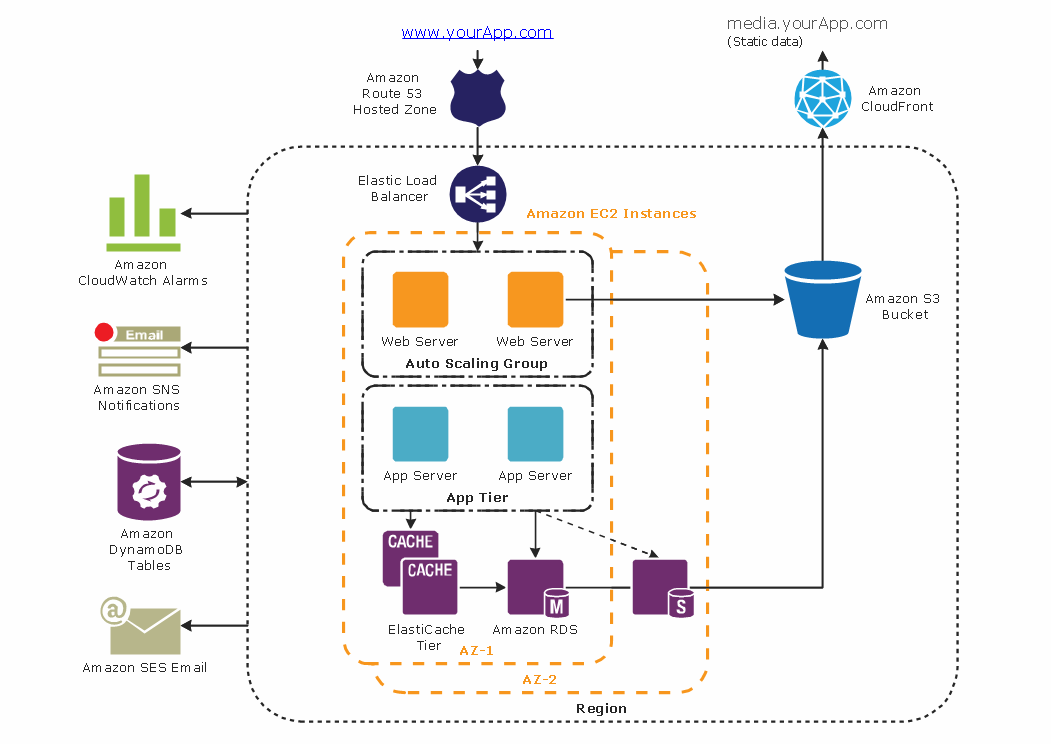
Cloud Computing Architecture
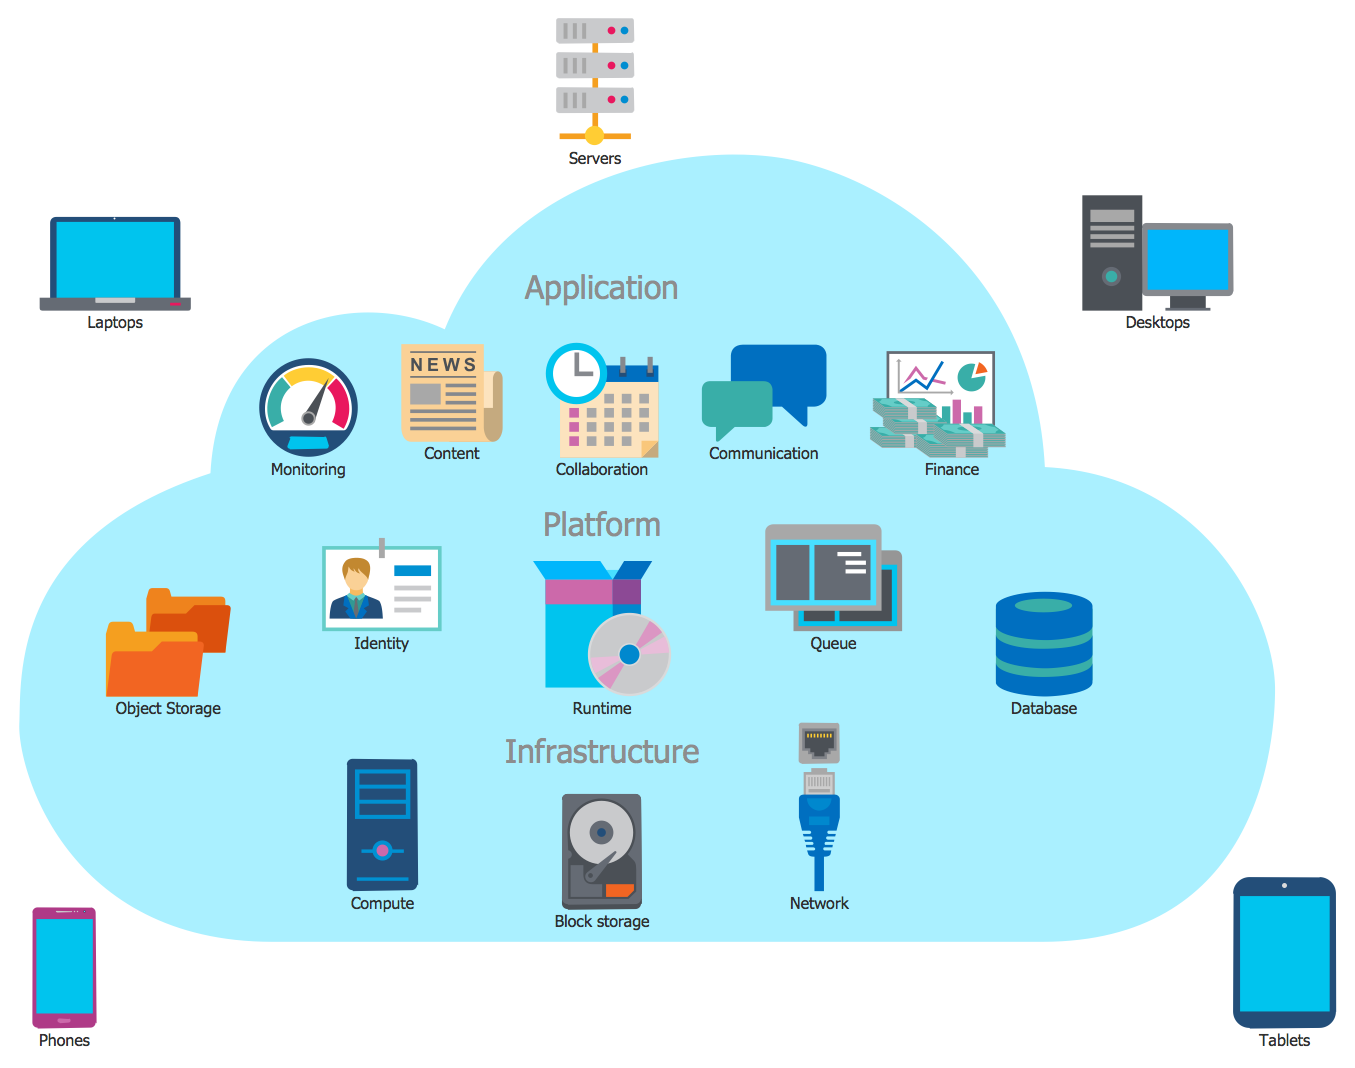
Amazon Cloud Computing Architecture

- Goal Vs Actual Salesforce Chart
- Salesforce Actual Vs Goals Chart
- Swim Lane Flowchart Symbols | Cross-Functional Flowchart (Swim ...
- Visio Examples Process Flow With Swim Lanes
- Gauge Chart
- Gauges Chart
- Diagram Of Bucket
- Entity Relationship Diagram Symbols | How To Make Chen ER ...
- Cloud Computing Architecture Diagrams | Design elements - Cloud ...
- Performance Indicators | Constant improvement of key performance ...
- Network Diagram Examples | Network Architecture | Local area ...
- Design elements - Sales dashboard | Sales Dashboard - Access ...
- Cloud Computing Diagrams | Cloud Computing Architecture ...
- How to Manage ConceptDraw Multi - User License | Basic Flowchart ...
- KPIs and Metrics | KPI Dashboard | The Facts and KPIs | Kpis
- Cafe performance metrics vs. air temperature - Visual dashboard ...
- 3-Tier Auto-scalable Web Application Architecture | Flowchart ...
- Azure Architecture | Azure Services | How to Create an Azure ...
- Performance Indicators | What is a KPI? | KPI Dashboard | Key ...
- Cloud Computing diagram | Cloud applications | Mobile cloud ...
- ERD | Entity Relationship Diagrams, ERD Software for Mac and Win
- Flowchart | Basic Flowchart Symbols and Meaning
- Flowchart | Flowchart Design - Symbols, Shapes, Stencils and Icons
- Flowchart | Flow Chart Symbols
- Electrical | Electrical Drawing - Wiring and Circuits Schematics
- Flowchart | Common Flowchart Symbols
- Flowchart | Common Flowchart Symbols