 Event-driven Process Chain Diagrams
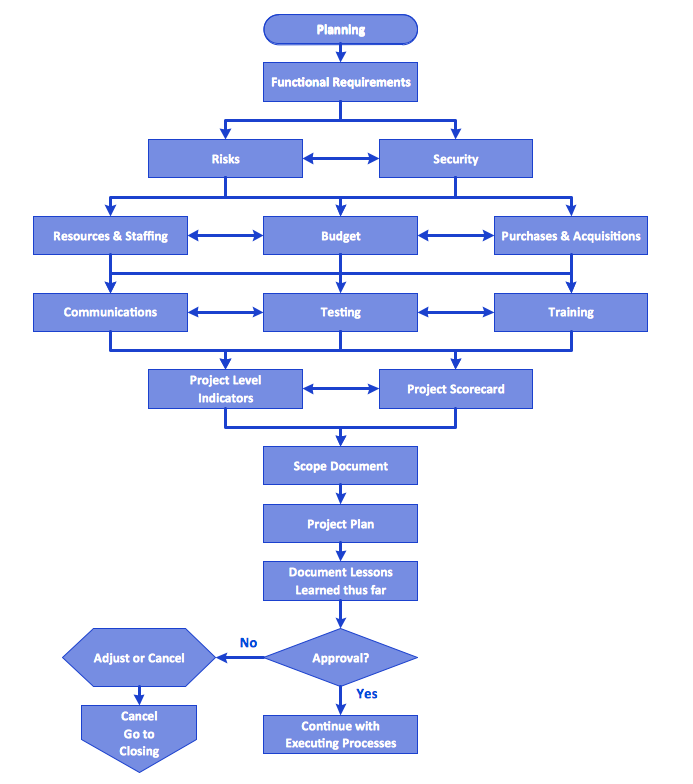
Event-driven Process Chain (EPC) Diagram is a type of flowchart widely used for modeling in business engineering and reengineering, business process improvement, and analysis. EPC method was developed within the Architecture of Integrated Information Systems (ARIS) framework.
Flow Chart Diagram Examples
Draw your own business process flowcharts using ConceptDraw PRO diagramming and business graphics software.The Flowcharts Solution for ConceptDraw PRO is a comprehensive set of examples and samples in several different color themes for professionals that need to graphically represent a process.
Workflow Process Example
One of the most popular option helps to draw diagrams faster is pre-designed set of examples related to each kind of diagram. ConceptDraw PRO software extended with the Workflow Diagrams solution delivers a complete set of workflow process examples helps you to start making your own workflow faster.Business Process Mapping — How to Map a Work Process
ConceptDraw PRO is a world-class diagramming platform that lets you display, communicate, and present dynamically. It′s powerful enough to draw everything from basic flowcharts to complex engineering schematics.Video tutorials on ConceptDraw products. Try it today!
Flowchart Software
Flowchart is widely used in business, education and economic presentations to help the audience visualize the content better, or to find flaws in a process flow diagrams. Flowcharts are particularly useful for displaying how a process currently flow or could ideally function. Flowcharts can help you see whether the steps of a process are logical, uncover problems or miscommunications, define the boundaries of a process, and develop a common base of knowledge about a process.ConceptDraw PRO flowchart software will help to quickly create new flowcharts, workflow, NS Diagram, BPMN Diagram, Cross-functional flowcharts, data flow diagrams and highlight flowcharts.
Feature-rich flowchart maker, free thousand flowchart examples and templates and colored symbols that will allow you to create professional looking flowcharts simply.
ConceptDraw PRO supports macOS and Windows.

 Cross-Functional Flowcharts
Cross-functional flowcharts are powerful and useful tool for visualizing and analyzing complex business processes which requires involvement of multiple people, teams or even departments. They let clearly represent a sequence of the process steps, the order of operations, relationships between processes and responsible functional units (such as departments or positions).
 Accounting Flowcharts
Accounting Flowcharts solution extends ConceptDraw PRO software with templates, samples and library of vector stencils for drawing the accounting flow charts.
Example Process Flow
A flowchart is a picture of the separate steps of a process in sequential order.ConceptDraw PRO is a Process Flowcharts software. This software includes basic package of process flow examples. The software contains object libraries with vector stencils that allows you use RapidDraw technology. By clicking on direction arrows you can add a new object to the flowchart.
Example of Flowchart Diagram
ConceptDraw - feature-rich flowchart software. This software includes flowchart diagram examples set. Libraries contain vector stencils that allow users to use RapidDraw technology. Users can start draw their own flowchart diagrams from existing examples by clicking on direction arrows.Basic Flowchart Examples
ConceptDraw PRO is a business flowchart software includes the wide flowchart examples package.Pie Chart Examples and Templates
A pie chart or a circle graph is a circular chart divided into sectors, illustrating numerical proportion. In a pie chart, the arc length of each sector and consequently its central angle and area, is proportional to the quantity it represents.Pie chart examples and templates created using ConceptDraw PRO software helps you get closer with pie charts and find pie chart examples suite your needs.
 Fishbone Diagram
Fishbone Diagrams solution extends ConceptDraw PRO software with templates, samples and library of vector stencils for drawing the Ishikawa diagrams for cause and effect analysis.
Process Flowchart
ConceptDraw is Professional business process mapping software for making process flow diagram, workflow diagram, general flowcharts and technical illustrations for business documents. It is includes rich examples, templates, process flowchart symbols. ConceptDraw flowchart maker allows you to easier create a process flowchart. Use a variety of drawing tools, smart connectors, flowchart symbols and shape libraries to create flowcharts of complex processes, process flow diagrams, procedures and information exchange.
Flowchart Process Example
ConceptDraw PRO is a professional software for creating great looking flowcharts. The samples included in this set of software allows users to draw any type of flowchart.
 Business Process Diagrams
Business Process Diagrams solution extends the ConceptDraw PRO BPM software with RapidDraw interface, templates, samples and numerous libraries based on the BPMN 1.2 and BPMN 2.0 standards, which give you the possibility to visualize equally easy simple and complex processes, to design business models, to quickly develop and document in details any business processes on the stages of project’s planning and implementation.
Types of Flowchart - Overview
When designing a process or an instruction in clear way, you should consider creating a flowchart. A Process Flow Diagram is the method. You can avoid wasting a lot of time understanding complex concepts as they get clear with different diagrams.
Pyramid Chart Examples
Seeking a solution for maximizing the efficiencies throughout the pyramid charts? ConceptDraw examples to help you create pyramid diagrams quickly.Business Process Modeling with ConceptDraw
Business Process Modeling Notation -BPMN- is a set of standard symbols that allow you to create a graphical view of a business process. The symbols were developed to help users develop standard, unified structure of processes, and any messages shared between these processes. This is business process improvement tools.Line Chart Examples
The Line Graphs solution from Graphs and Charts area of ConceptDraw Solution Park contains a set of examples, templates and design elements library of line and scatter charts. Use it to draw line and scatter graphs using ConceptDraw PRO diagramming and vector drawing software for illustrating your documents, presentations and websites.Basic Workflow Examples
ConceptDraw PRO with the Workflow Diagrams solution delivers a complete set of samples and templates. This set contains basic workflow examples you may use to start drawing your own workflow or to get closer with workflow idea.- Flow process chart
- Business Process Diagram | Workflow Process Example | Business ...
- Example Process Flow | Flow Chart Diagram Examples | Accounting ...
- Example Process Flow | Flow Chart Diagram Examples | Process ...
- Business Process Diagram | Business Process Modeling with ...
- Flowchart Process Example | Business Processes | How to Build a ...
- Example Process Flow
- Flow Chart Diagram Examples
- Flow Chart Diagram Examples | Accounting Flowcharts | Example ...
- Cross Functional Flowchart Examples | Types of Flowchart ...
- Business process Flow Chart - Event-Driven Process chain (EPC)
- Business Process Diagram | Business process Flow Chart - Event ...
- Business Processes | Workflow Diagram Template | Workflow ...
- Workflow Process Example | Business Process Modeling Tools ...
- Work Flow Process Chart | Flow Diagram Software | Business ...
- Process Flowchart | Business process Flow Chart - Event-Driven ...
- Flow Chart Diagram Examples
- Flow Chart Diagram Examples
- Business Process Diagram | Basic Workflow Examples | Event ...
- Business Process Diagram | Basic Workflow Examples | Workflow ...
- ERD | Entity Relationship Diagrams, ERD Software for Mac and Win
- Flowchart | Basic Flowchart Symbols and Meaning
- Flowchart | Flowchart Design - Symbols, Shapes, Stencils and Icons
- Flowchart | Flow Chart Symbols
- Electrical | Electrical Drawing - Wiring and Circuits Schematics
- Flowchart | Common Flowchart Symbols
- Flowchart | Common Flowchart Symbols


