Brilliant Examples of Infographics Map, Transport, Road

"The symbols and conventions used in welding documentation are specified in national and international standards such as ISO 2553 Welded, brazed and soldered joints -- Symbolic representation on drawings and ISO 4063 Welding and allied processes -- Nomenclature of processes and reference numbers. The US standard symbols are outlined by the American National Standards Institute and the American Welding Society and are noted as "ANSI/ AWS".
In engineering drawings, each weld is conventionally identified by an arrow which points to the joint to be welded. The arrow is annotated with letters, numbers and symbols which indicate the exact specification of the weld. In complex applications, such as those involving alloys other than mild steel, more information may be called for than can comfortably be indicated using the symbols alone. Annotations are used in these cases." [Symbols and conventions used in welding documentation. Wikipedia]
The example chart "Elements of welding symbol" is redesigned using the ConceptDraw PRO diagramming and vector drawing software from the Wikipedia file: Elements of a welding symbol.PNG.
[en.wikipedia.org/ wiki/ File:Elements_ of_ a_ welding_ symbol.PNG]
The diagram example "Elements location of a welding symbol" is contained in the Mechanical Engineering solution from the Engineering area of ConceptDraw Solution Park.
Welding joint symbol chart

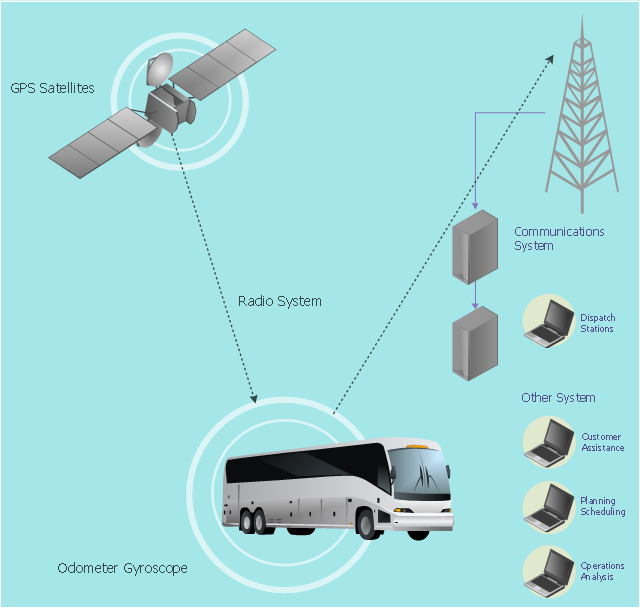
This vehicular network diagram example was drawn on the base of picture illustrating the article "Automatic Vehicle Location: Rural Transit" from the website of the Research and Innovative Technology Administration (RITA), U.S. Department of Transportation (US DOT).
"Automatic Vehicle Location (AVL) systems calculate the real-time location of any vehicle equipped with a Global Positioning Satellite (GPS) receiver. Data are then transmitted to the transit center with use of radio or cellular communications and can be used immediately for daily operations as well as archived for further analysis.
As a stand-alone technology, an AVL system can be used to monitor on-time performance. When combined with other technologies, AVL can deliver many benefits in the areas of fleet management, service planning, safety and security, traveler information, fare payment, vehicle component monitoring, and data collection. Since the greatest benefits from AVL are achieved by combining it with other Intelligent Transportation System (ITS) technologies, AVL is most appropriate for large rural agencies with more than 30 vehicles that plan to implement a comprehensive ITS."
[pcb.its.dot.gov/ factsheets/ avl/ avlRural_ overview.asp]
The vehicular network diagram example "Automatic vehicle location" was created using the ConceptDraw PRO diagramming and vector drawing software extended with the Vehicular Networking solution from the Computer and Networks area of ConceptDraw Solution Park.
Vehicular network diagram
Used Solutions
Virtual private networks (VPN). Computer and Network Examples

This example was created in ConceptDraw DIAGRAM using the Computer and Networks Area of ConceptDraw Solution Park and shows the Virtual Private Network (VPN) diagram.

This location map sample was created on the base on the map "Location of the Migration Health Assessment Center (MHAC)" from the website of the U.S. Embassy in Nepal. "Applicants for U.S. immigrant visas and transportation letters are required to have medical examinations performed by IOM (International Organization for Migration) Embassy panel physicians. ... Health assessments for the immigrants to the US are conducted by the International Organization for Migration (IOM) at the Migration Health Assessment Center."
[nepal.usembassy.gov/ visas/ immigrant-visas/ medical-exams.html]
The location map example "Location of the Migration Health Assessment Center (MHAC)" was created using the ConceptDraw PRO diagramming and vector drawing software extended with the Directional Maps solution from the Maps area of ConceptDraw Solution Park.
Location map
.png--diagram-flowchart-example.png)
How tо Represent Information Graphically

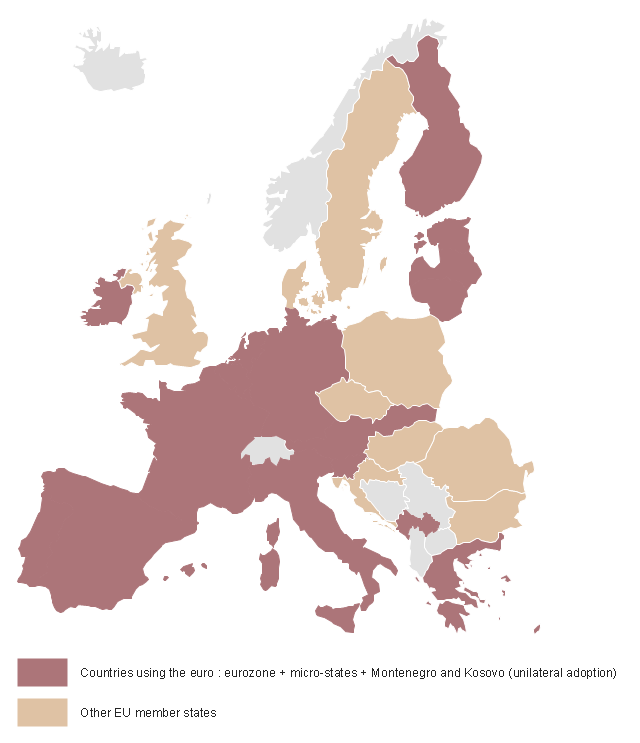
This Germany political map example was created on the base of Wikimedia Commons file: BlueEurozone.svg. [commons.wikimedia.org/ wiki/ File:BlueEurozone.svg]
"The eurozone, officially called the euro area, is a monetary union of 19 of the 28 European Union (EU) member states which have adopted the euro (€) as their common currency and sole legal tender. The other nine members of the European Union continue to use their own national currencies.
The eurozone consists of Austria, Belgium, Cyprus, Estonia, Finland, France, Germany, Greece, Ireland, Italy, Latvia, Lithuania, Luxembourg, Malta, the Netherlands, Portugal, Slovakia, Slovenia, and Spain." [Eurozone. Wikipedia]
The political map example "Map of Germany in Eurozone" was designed using the ConceptDraw PRO software extended with the Map of Germany solution from the Maps area of ConceptDraw Solution Park.
Political map example
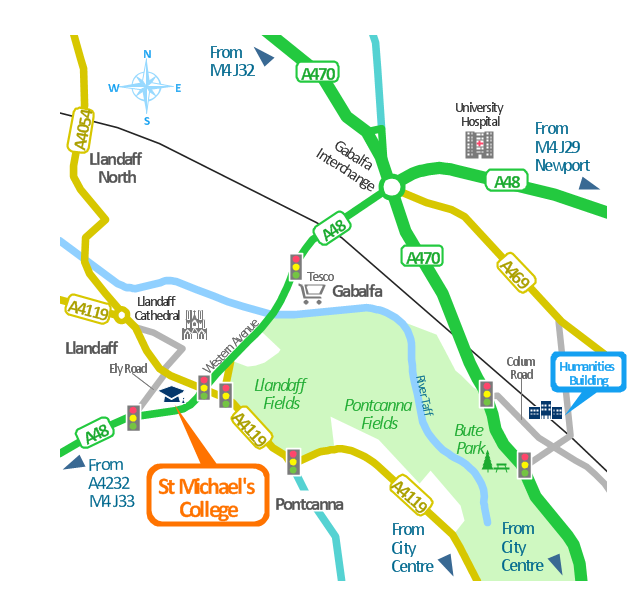
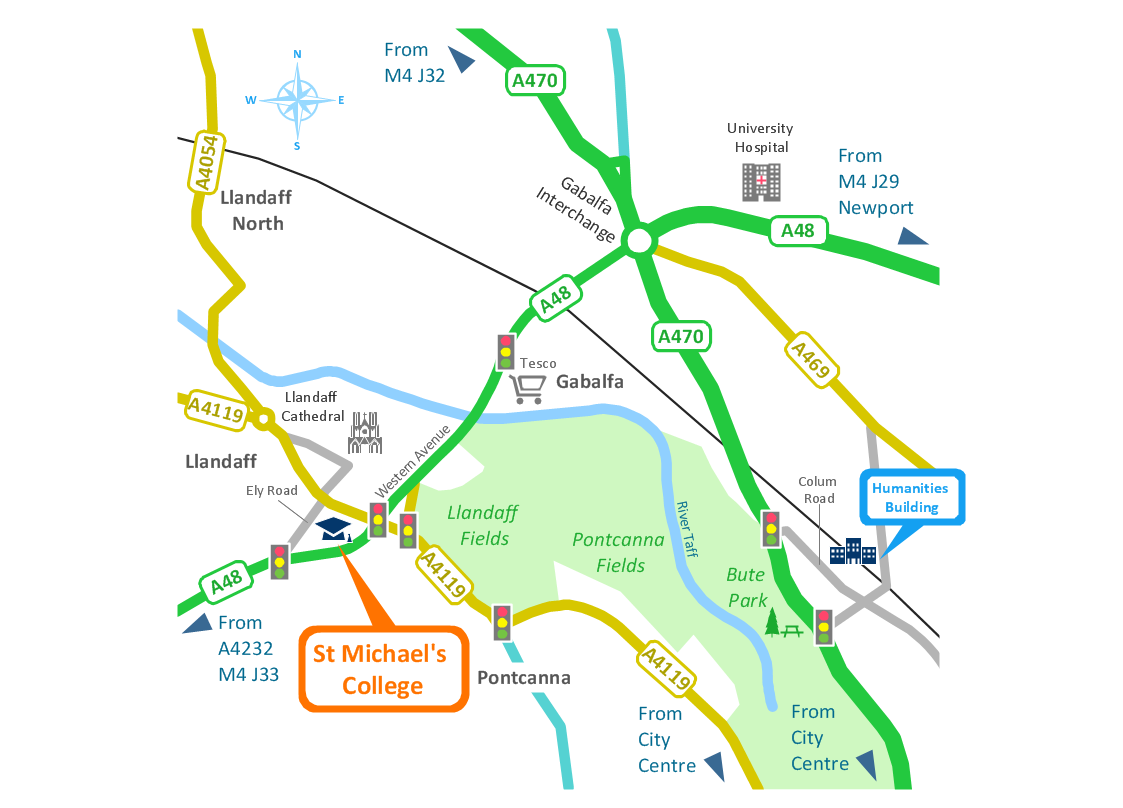
This spatial infographics was created on the bese of the conference centre location map from the website. [cf.ac.uk/ share/ research/ centres/ clarc/ newsandevents/ isns-conference-2013-booking-information.html]
"The terms location and place in geography are used to identify a point or an area on the Earth's surface or elsewhere. The term location generally implies a higher degree of certainty than place, which often indicates an entity with an ambiguous boundary, relying more on human/ social attributes of place identity and sense of place than on geometry.
Types of location/ place.
(1) A relative location is described as a displacement from another site...
(2) A locality is likely to have a well-defined name but a boundary which is less well defined and which varies by context." [Location (geography). Wikipedia]
The spatial infographics example "Conference centre location map" was created using the ConceptDraw PRO diagramming and vector drawing software extended with the Spatial Infographics solution from the area "What is Infographics" of ConceptDraw Solution Park.
Spatial infographics
Spatial infographics Design Elements: Transport Map
Spatial infographics Design Elements: Location Map
- Location Plan And Vicinity Map Sample
- Elements location of a welding symbol | Examples Flowchart | Iso ...
- Spatial infographics Design Elements: Location Map | Brilliant ...
- Example Of Location
- Www Example Of Geographical Location
- Landmarks - Vector stencils library | Design elements - Location ...
- Welding symbols | Elements location of a welding symbol | Design ...
- Vicinity Map Example
- Elements location of a welding symbol | Basic Audit Flowchart ...
- Location Of The Map Example
- ERD | Entity Relationship Diagrams, ERD Software for Mac and Win
- Flowchart | Basic Flowchart Symbols and Meaning
- Flowchart | Flowchart Design - Symbols, Shapes, Stencils and Icons
- Flowchart | Flow Chart Symbols
- Electrical | Electrical Drawing - Wiring and Circuits Schematics
- Flowchart | Common Flowchart Symbols
- Flowchart | Common Flowchart Symbols