This histogram example was redesigned from the Wikimedia Commons file: Age of presidental ascention.jpg.
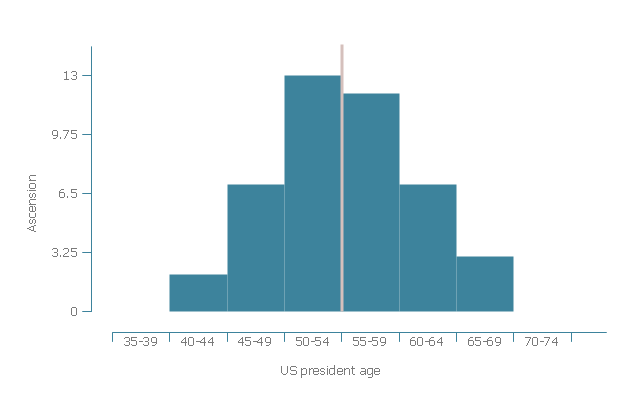
"Age of US president at date of ascension to office in five-year age groups."
[commons.wikimedia.org/ wiki/ File:Age_ of_ presidental_ ascention.jpg]
This file is licensed under the Creative Commons Attribution-Share Alike 3.0 Unported license. [creativecommons.org/ licenses/ by-sa/ 3.0/ deed.en]
"Age of presidents when assuming office approximately follows a bell curve (mean age marked by red line, c. 55 years)" [List of Presidents of the United States by age. Wikipedia]
The histogram example "Age of presidential ascension" was created using the ConceptDraw PRO software extended with the Seven Basic Tools of Quality solution from the Quality area of ConceptDraw Solution Park.
Histogram
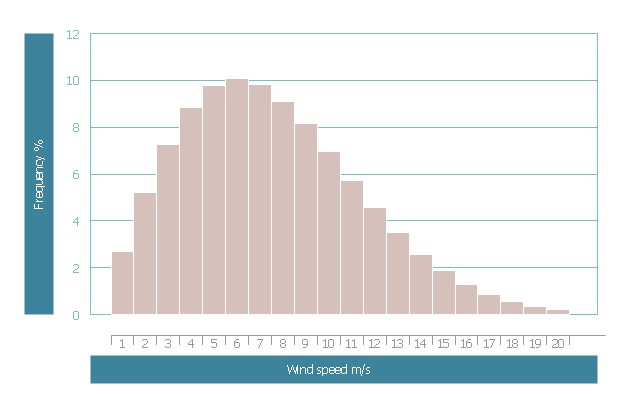
This wind speed frequency distribution histogram example was redesigned from the Wikimedia Commons file: Frekvensfördelning.jpg.
[commons.wikimedia.org/ wiki/ File:Frekvensf%C3%B6rdelning.jpg]
This file is licensed under the Creative Commons Attribution-Share Alike 3.0 Unported license. [creativecommons.org/ licenses/ by-sa/ 3.0/ deed.en]
Example of frequency distribution of wind speed. Each bar represents the range of 1 m / s. Over 10 percent of the time the wind blows from 5.5 to 6.5 m / s, which is the most common wind speed. The mean wind speed is 7 m / s. [Vindkraft. Swedish Wikipedia]
The example "Wind speed histogram" was created using the ConceptDraw PRO software extended with the Seven Basic Tools of Quality solution from the Quality area of ConceptDraw Solution Park.
Histogram example
- Histogram Example For Software Development
- Seven Basic Tools of Quality - Histogram | Histogram example - Age ...
- Histogram Business Example
- Histograms | Chart Examples | Bar Chart | Histogram Languages ...
- Chart Examples | Frequency distribution dashboard - Template ...
- Histogram example - Age of presidential ascension | How To Make a ...
- Histogram Examples For Project
- Histogram | Basic Diagramming | Pie Chart Software | Histograms ...
- Histograms | Black cherry tree histogram | Example Of Genus
- Histogram Diagram Example
- ERD | Entity Relationship Diagrams, ERD Software for Mac and Win
- Flowchart | Basic Flowchart Symbols and Meaning
- Flowchart | Flowchart Design - Symbols, Shapes, Stencils and Icons
- Flowchart | Flow Chart Symbols
- Electrical | Electrical Drawing - Wiring and Circuits Schematics
- Flowchart | Common Flowchart Symbols
- Flowchart | Common Flowchart Symbols