"In software engineering, an entity–relationship model (ER model) is a data model for describing a database in an abstract way.Chen's notation for entity–relationship modeling uses rectangles to represent entity sets, and diamonds to represent relationships appropriate for first-class objects: they can have attributes and relationships of their own. If an entity set participates in a relationship set, they are connected with a line.
Attributes are drawn as ovals and are connected with a line to exactly one entity or relationship set." [Entity–relationship model. Wikipedia]
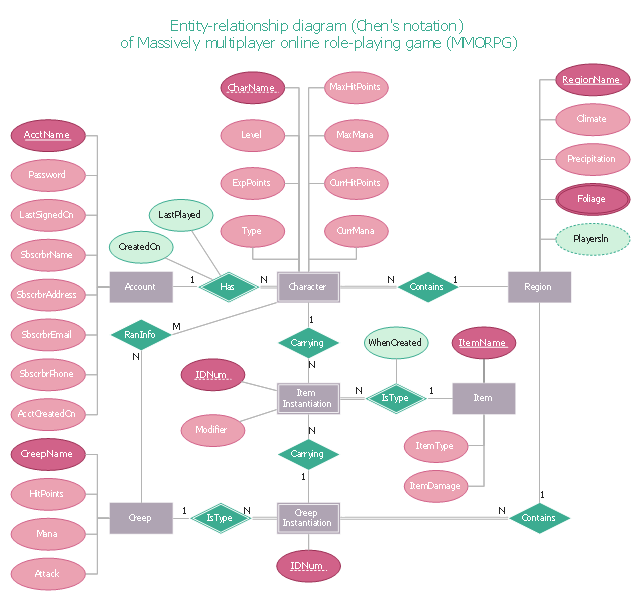
This sample Chen's ER-diagram illustrates the structure of a typical MMORP game.
"Massively multiplayer online role-playing game (MMORPG) mixes the genres of role-playing video games and Massively multiplayer online games, possibly in the form of web browser-based games, in which a very large number of players interact with one another within a virtual world.
As in all RPGs, players assume the role of a character (often in a fantasy world or science-fiction world) and take control over many of that character's actions. MMORPGs are distinguished from single-player or small multi-player online RPGs by the number of players, and by the game's persistent world (usually hosted by the game's publisher), which continues to exist and evolve while the player is offline and away from the game." [Massively multiplayer online role-playing game. Wikipedia]
This ERD example was redrawn using the ConceptDraw PRO diagramming and vector drawing software from the Wikipedia file: ER Diagram MMORPG.png. [en.wikipedia.org/ wiki/ File:ER_ Diagram_ MMORPG.png]
This file is licensed under the Creative Commons Attribution-Share Alike 3.0 Unported license. [creativecommons.org/ licenses/ by-sa/ 3.0/ deed.en]
This Chen's ERD example is included in the Entity-Relationship Diagram (ERD) solution from the Software Development area of ConceptDraw Solution Park.
Attributes are drawn as ovals and are connected with a line to exactly one entity or relationship set." [Entity–relationship model. Wikipedia]
This sample Chen's ER-diagram illustrates the structure of a typical MMORP game.
"Massively multiplayer online role-playing game (MMORPG) mixes the genres of role-playing video games and Massively multiplayer online games, possibly in the form of web browser-based games, in which a very large number of players interact with one another within a virtual world.
As in all RPGs, players assume the role of a character (often in a fantasy world or science-fiction world) and take control over many of that character's actions. MMORPGs are distinguished from single-player or small multi-player online RPGs by the number of players, and by the game's persistent world (usually hosted by the game's publisher), which continues to exist and evolve while the player is offline and away from the game." [Massively multiplayer online role-playing game. Wikipedia]
This ERD example was redrawn using the ConceptDraw PRO diagramming and vector drawing software from the Wikipedia file: ER Diagram MMORPG.png. [en.wikipedia.org/ wiki/ File:ER_ Diagram_ MMORPG.png]
This file is licensed under the Creative Commons Attribution-Share Alike 3.0 Unported license. [creativecommons.org/ licenses/ by-sa/ 3.0/ deed.en]
This Chen's ERD example is included in the Entity-Relationship Diagram (ERD) solution from the Software Development area of ConceptDraw Solution Park.
Chen's ERD
Components of ER Diagram

ERD Symbols and Meanings

The Chen's ERD notation is still used and is considered to present a more detailed way of representing entities and relationships.
To create an ERD, software engineers mainly turn to dedicated drawing software, which contain the full notation resources for their specific database design - ERD symbols and meanings. CS Odessa has released an all-inclusive Entity-Relationship Diagram (ERD) solution for their powerful drawing program, ConceptDraw DIAGRAM.

Design Element: Crows Foot for Entity Relationship Diagram - ERD

Entity Relationship Diagram Symbols

ERD symbols used for professional ERD drawing are collected in libraries from the Entity-Relationship Diagram (ERD) solution for ConceptDraw DIAGRAM.
Entity-Relationship Diagram

UML Use Case Diagram Example - Estate Agency

This sample shows the work of the estate agency and is used by the estate agencies, building companies, at the trainings of the estate agencies, for understanding the working processes of the estate agencies.
Drawing ER diagrams on a Mac

Data Flow Diagram Example

E-R Diagrams

Entity Relationship Diagram Software Engineering

Professional ERD drawing is an essential software engineering method for database modeling. ConceptDraw DIAGRAM as a powerful Entity Relationship Diagram Software Engineering offers the tools of Entity-Relationship Diagram (ERD) solution from Software Development area of ConceptDraw Solution Park.
ER diagram tool for OS X

Entity Relationship Software

The vector graphic diagrams produced when using the ConceptDraw ERD solution can be used in whitepapers, presentations, datasheets, posters, or any technical materials.
It is convenient to design ER Diagrams using ConceptDraw DIAGRAM software. ConceptDraw DIAGRAM extended with the Entity-Relationship Diagram (ERD) solution supports Chen's and Crow’s Foot notations that are often used to describe database structure.
UML Component for Bank

 Entity-Relationship Diagram (ERD)
An Entity-Relationship Diagram (ERD) is a visual presentation of entities and relationships. That type of diagrams is often used in the semi-structured or unstructured data in databases and information systems. At first glance ERD is similar to a flowch
Entity-Relationship Diagram (ERD) with ConceptDraw DIAGRAM
 <br>with ConceptDraw DIAGRAM *")
one-to-many, many-to-many.
Draw Entity-Relationship Diagrams (ERD) easily with ConceptDraw extended with Entity-Relationship Diagram (ERD) Solution from the Software Development Area. Use ERD software to create ER diagram.
How to Draw ER Diagrams

Employment Form Software

It's very easy and convenient to use the employment form templates from the Basic Diagramming Solution for ConceptDraw DIAGRAM as the base for creating your own employment forms.
Entity Relationship Diagram Examples

ConceptDraw DIAGRAM diagramming and vector drawing software gives the ability to describe a database using the Entity-Relationship model. Entity-Relationship Diagram(ERD) solution from the Software Development area supplies the ConceptDraw DIAGRAM with icons advocated by Chen's and Crow’s Foot notation that can be used when describing a database.
Entity Relationship Diagram - ERD - Software for Design Chen ER Diagrams
_Win_Mac.png "Entity Relationship Diagram - ERD - Software for Design <br>Chen ER Diagrams *")
- Example Of Erd Diagram Games Development
- Erd For Game Development
- Entity Relationship Diagram Example Of Android Game
- How To Make Chen ER Diagram | Entity Relationship Diagram ...
- Data Flow Diagrams | Example of DFD for Online Store (Data Flow ...
- Game Er Diagram
- Entity Relationship Diagram For Online Multi Player Game
- Data Flow Diagrams | Example of DFD for Online Store (Data Flow ...
- Chen's ERD of MMORPG | Android GUI | Examples of Flowcharts ...
- Chen's ERD of MMORPG | Er Diagram Online Gaming
- Developing Entity Relationship Diagrams | Entity Relationship ...
- Entity-Relationship Diagram ( ERD ) | Chen's ERD of MMORPG ...
- Video Game Mobile Entity Relationship Diagram
- Chen's ERD of MMORPG | Erd For Multiplayer Games
- Chen's ERD of MMORPG | Entity Relationship Diagram - ERD ...
- Chen's ERD of MMORPG | Design elements - ER diagram (Chen ...
- Chen's ERD of MMORPG | Entity-Relationship Diagram ( ERD ...
- Entity-Relationship Diagram ( ERD ) | Chen's ERD of MMORPG ...
- Entity-Relationship Diagram (ERD) | Design elements - ER diagram ...
- Context Diagram For Android Game
- ERD | Entity Relationship Diagrams, ERD Software for Mac and Win
- Flowchart | Basic Flowchart Symbols and Meaning
- Flowchart | Flowchart Design - Symbols, Shapes, Stencils and Icons
- Flowchart | Flow Chart Symbols
- Electrical | Electrical Drawing - Wiring and Circuits Schematics
- Flowchart | Common Flowchart Symbols
- Flowchart | Common Flowchart Symbols