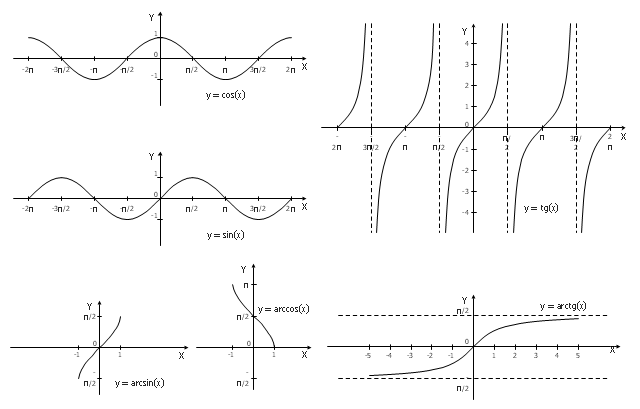
The vector stencils library "Trigonometric functions" contains 8 shapes of trigonometrical and inverse trigonometrical functions graphs.
"In mathematics, the trigonometric functions (also called the circular functions) are functions of an angle. They relate the angles of a triangle to the lengths of its sides. Trigonometric functions are important in the study of triangles and modeling periodic phenomena, among many other applications.
The most familiar trigonometric functions are the sine, cosine, and tangent. In the context of the standard unit circle with radius 1 unit, where a triangle is formed by a ray originating at the origin and making some angle with the x-axis, the sine of the angle gives the length of the y-component (the opposite to the angle or the rise) of the triangle, the cosine gives the length of the x-component (the adjacent of the angle or the run), and the tangent function gives the slope (y-component divided by the x-component). More precise definitions are detailed below. Trigonometric functions are commonly defined as ratios of two sides of a right triangle containing the angle, and can equivalently be defined as the lengths of various line segments from a unit circle. More modern definitions express them as infinite series or as solutions of certain differential equations, allowing their extension to arbitrary positive and negative values and even to complex numbers." [Trigonometric functions. Wikipedia]
The shapes example "Design elements - Trigonometric functions" was created using the ConceptDraw PRO diagramming and vector drawing software extended with the Mathematics solution from the Science and Education area of ConceptDraw Solution Park.
Trigonometrical and inverse trigonometrical functions - Graphs
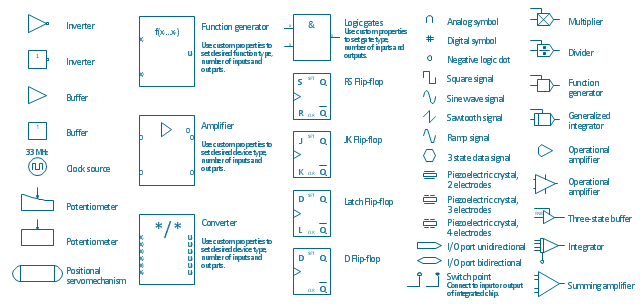
The vector stencils library "Analog and digital logic" contains 40 element symbols of logic (threshold) gates, bistable current switches, current controllers, regulators, electrical generators, and amplifiers.
Use it for drawing the digital and analog functions in electronic circuit diagrams and electrical schematics.
"Analogue electronics (or analog in American English) are electronic systems with a continuously variable signal, in contrast to digital electronics where signals usually take only two different levels. The term "analogue" describes the proportional relationship between a signal and a voltage or current that represents the signal." [Analogue electronics. Wikipedia]
"Digital electronics, or digital (electronic) circuits, represent signals by discrete bands of analog levels, rather than by a continuous range. All levels within a band represent the same signal state. Relatively small changes to the analog signal levels due to manufacturing tolerance, signal attenuation or parasitic noise do not leave the discrete envelope, and as a result are ignored by signal state sensing circuitry.
In most cases the number of these states is two, and they are represented by two voltage bands: one near a reference value (typically termed as "ground" or zero volts) and a value near the supply voltage, corresponding to the "false" ("0") and "true" ("1") values of the Boolean domain respectively.
Digital techniques are useful because it is easier to get an electronic device to switch into one of a number of known states than to accurately reproduce a continuous range of values.
Digital electronic circuits are usually made from large assemblies of logic gates, simple electronic representations of Boolean logic functions." [Digital electronics. Wikipedia]
The example "Design elements - Analog and digital logic" was drawn using the ConceptDraw PRO diagramming and vector drawing software extended with the Electrical Engineering solution from the Engineering area of ConceptDraw Solution Park.
Analog and digital logic elements
HelpDesk
Event-driven Process Chain (EPC) Diagram Software

An EPC diagram shows different business processes through various workflows. The workflows are seen as functions and events that are connected by different teams or people, as well as tasks that allow business processes to be executed. The best thing about this type of enterprise modelling is that creating an EPC diagram is quick and simple as long as you have the proper tool. One of the main usages of the EPC diagrams is in the modelling, analyzing and re-engineering of business processes. With the use of the flowchart, businesses are able to see inefficiencies in the processes and modify to make them more productive. Event-driven process chain diagrams are also used to configure an enterprise resource pla
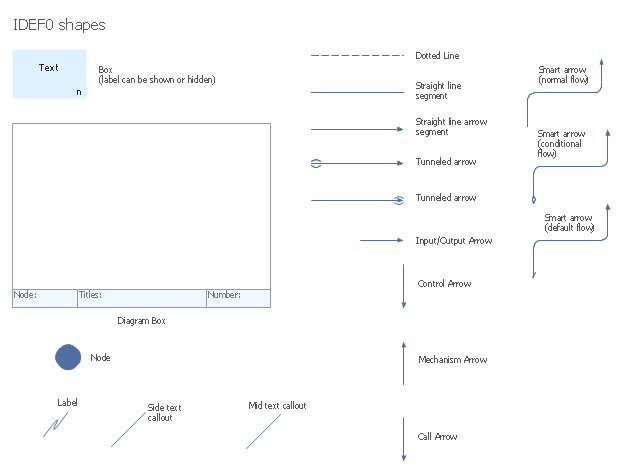
The vector stencils library "IDEF0 diagrams" contains 18 symbols for drawing IDEF0 function modeling diagrams using the ConceptDraw PRO diagramming and vector drawing software.
"The IDEF0 model ... is based on a simple syntax. Each activity is described by a verb-based label placed in a box. Inputs are shown as arrows entering the left side of the activity box while output are shown as exiting arrows on the right side of the box. Controls are displayed as arrows entering the top of the box and mechanisms are displayed as arrows entering from the bottom of the box. Inputs, Controls, Outputs, and Mechanisms are all referred to as concepts.
- Arrow : A directed line, composed of one or more arrow segments, that models an open channel or conduit conveying data or objects from source (no arrowhead) to use (with arrowhead). There are 4 arrow classes: Input Arrow, Output Arrow, Control Arrow, and Mechanism Arrow (includes Call Arrow). See Arrow Segment, Boundary Arrow, Internal Arrow.
- Box : A rectangle, containing a name and number, used to represent a function.
- Context : The immediate environment in which a function (or set of functions on a diagram) operates.
- Decomposition : The partitioning of a modeled function into its component functions.
- Fork : The junction at which an IDEF0 arrow segment (going from source to use) divides into two or more arrow segments. May denote unbundling of meaning.
- Function : An activity, process, or transformation (modeled by an IDEF0 box) identified by a verb or verb phrase that describes what must be accomplished.
- Join : The junction at which an IDEF0 arrow segment (going from source to use) merges with one or more other arrow segments to form a single arrow segment. May denote bundling of arrow segment meanings.
- Node : A box from which child boxes originate; a parent box. See Node Index, Node Tree, Node Number, Node Reference, Diagram Node Number." [IDEF0. Wikipedia]
The example "Design elements - IDEF0 diagram" is included in the IDEF0 Diagrams solution from the Software Development area of ConceptDraw Solution Park.
IDEF0 symbols
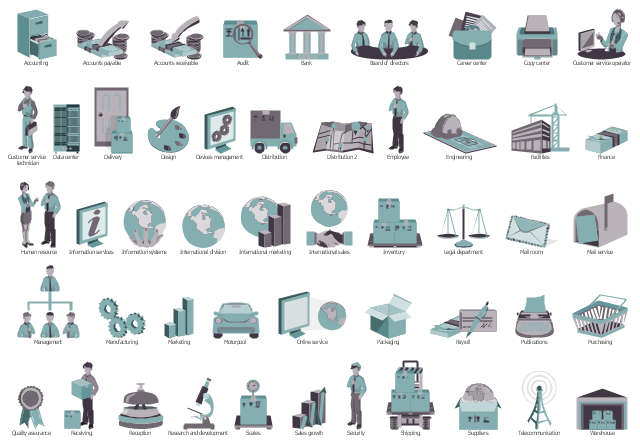
The vector stencils library "HR department" contains 49 department symbols.
Use it to design your HR flowcharts, workflow diagrams and process charts by the ConceptDraw PRO diagramming and vector drawing software.
"Functional departmentalization - Grouping activities by functions performed. Activities can be grouped according to function (work being done) to pursue economies of scale by placing employees with shared skills and knowledge into departments for example human resources, IT, accounting, manufacturing, logistics, and engineering. Functional departmentalization can be used in all types of organizations." [Departmentalization. Wikipedia]
The shapes example "Design elements - HR department" is included in the HR Flowcharts solution from the Management area of ConceptDraw Solution Park.
Department symbols for HR workflow diagrams
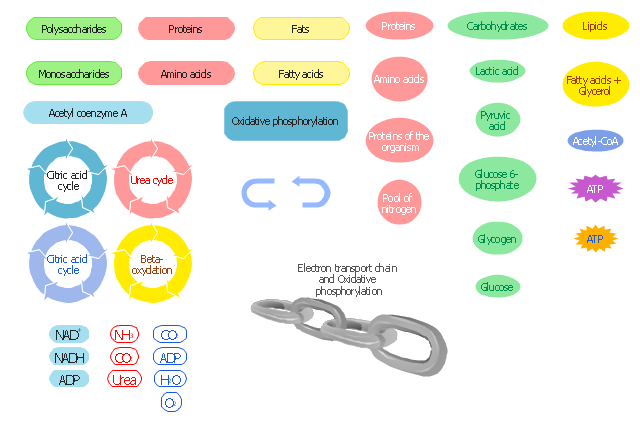
The vector stencils library " Biochemistry of metabolism" contains 46 metabolite symbols for drawing metabolic pathways maps, biochemical diagrams and metabolism process flow charts using the ConceptDraw PRO diagramming and vector drawing software.
"Metabolites are the intermediates and products of metabolism. The term metabolite is usually restricted to small molecules. Metabolites have various functions, including fuel, structure, signaling, stimulatory and inhibitory effects on enzymes, catalytic activity of their own (usually as a cofactor to an enzyme), defense, and interactions with other organisms (e.g. pigments, odorants, and pheromones). A primary metabolite is directly involved in normal "growth", development, and reproduction. Alcohol is an example of a primary metabolite produced in large-scale by industrial microbiology. A secondary metabolite is not directly involved in those processes, but usually has an important ecological function. Examples include antibiotics and pigments such as resins and terpenes etc. ...
The metabolome forms a large network of metabolic reactions, where outputs from one enzymatic chemical reaction are inputs to other chemical reactions." [Metabolite. Wikipedia]
The shapes example "Design elements - Biochemistry of metabolism" is included in the Biology solution from the Science and Education area of ConceptDraw Solution Park.
Metabolic pathway symbols
Diagramming Software for Design Business Process Diagrams
")

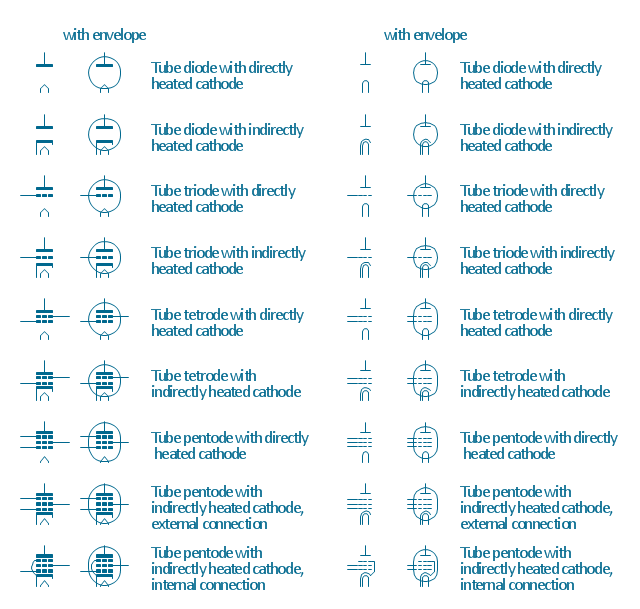
The vector stencils library "Design elements - Electron tubes" contains 36 element symbols of electron tubes.
Use it for drawing electrical schematics and electronic circuit diagrams.
"One classification of vacuum tubes is by the number of active electrodes, (neglecting the filament or heater). A device with two active elements is a diode, usually used for rectification. Devices with three elements are triodes used for amplification and switching. Additional electrodes create tetrodes, pentodes, and so forth, which have multiple additional functions made possible by the additional controllable electrodes.
Other classifications are:
(1) by frequency range (audio, radio, VHF, UHF, microwave),
(2) by power rating (small-signal, audio power, high-power radio transmitting),
(3) by design (e.g., sharp- versus remote-cutoff in some pentodes),
(4) by application (receiving tubes, transmitting tubes, amplifying or switching, rectification, mixing),
(5) special qualities (long life, very low microphonic and low noise audio amplification, and so on).
Multiple classifications may apply to a device; for example similar dual triodes can be used for audio preamplification and as flip-flops in computers, although linearity is important in the former case and long life in the latter.
Tubes have different functions, such as cathode ray tubes which create a beam of electrons for display purposes (such as the television picture tube) in addition to more specialized functions such as electron microscopy and electron beam lithography. X-ray tubes are also vacuum tubes. Phototubes and photomultipliers rely on electron flow through a vacuum, though in those cases electron emission from the cathode depends on energy from photons rather than thermionic emission." [Vacuum tube. Wikipedia]
The symbols example "Design elements - Electron tubes" was drawn using the ConceptDraw PRO diagramming and vector drawing software extended with the Electrical Engineering solution from the Engineering area of ConceptDraw Solution Park.
Vacuum tubes
"Classic TQM Tools ...
Flow Charts Pictures, symbols or text coupled with lines, arrows on lines show direction of flow. Flowcharting enables
modeling of processes; problems/ opportunities and decision points etc. It develops a common understanding of a process by those in
volved." [whaqualitycenter.org/ Portals/ 0/ Tools%20 to%20 Use/ Classic%20 Quality%20 Tools/ Classic%20 TQM%20 Tools%20 R%20 2-12.pdf]
The vector stencils library TQM diagrams contains 58 symbols for drawing total quality management (TQM) flow charts using the ConceptDraw PRO diagramming and vector drawing software.
The example "Design elements - TQM diagram" is included in the Total Quality Management (TQM) Diagrams solution from the Quality area of ConceptDraw Solution Park.
TQM flow chart symbols

- Design elements - Trigonometric functions | Mathematics Symbols ...
- Design elements - Trigonometric functions | Sine function ...
- Design elements - Trigonometric functions | Mathematics | Sine ...
- Design elements - Time series charts | Line Graph | Design ...
- Design elements - Cisco WAN | Network Glossary Definition | The ...
- 2^x Function graph | Design elements - Education charts | Design ...
- Quality function deployment chart template | Management | Design ...
- Design elements - TQM diagram | Examples of Flowcharts, Org ...
- Sine function | How to Use the Export To PowerPoint Function in ...
- Elements Science Examples
- Cross-Functional Flowchart | Flow Chart Symbols | Design elements ...
- Control Function On The Single Line Diagram
- Design elements - Electrical circuits | Step Function In Dc Electrical ...
- Function Of Money In Flow Chart
- Flow Chart Symbols | Cross-Functional Flowchart | Design elements ...
- Design elements - TQM diagram | Cross-Functional Flowcharts ...
- Design elements - Transformers and windings | Electrical Diagram ...
- Design elements - Picture graphs | Design elements - Line graphs ...
- An Example Of Lines As A Graphing Designing Element
- Flow Chart Symbols | Cross-Functional Flowchart | Design elements ...
- ERD | Entity Relationship Diagrams, ERD Software for Mac and Win
- Flowchart | Basic Flowchart Symbols and Meaning
- Flowchart | Flowchart Design - Symbols, Shapes, Stencils and Icons
- Flowchart | Flow Chart Symbols
- Electrical | Electrical Drawing - Wiring and Circuits Schematics
- Flowchart | Common Flowchart Symbols
- Flowchart | Common Flowchart Symbols