Venn Diagram Examples for Problem Solving. Environmental Social Science. Human Sustainability Confluence

Create your Venn diagrams for problem solving in environmental social science using the ConceptDraw DIAGRAM diagramming and vector drawing software extended with the Venn Diagrams solution from the area "Diagrams" of ConceptDraw Solution Park.
UML Use Case Diagram Example. Social Networking Sites Project

This sample shows the Facebook Socio-health system and is used at the projection and creating of the social networking sites.
 Entity-Relationship Diagram (ERD)
Entity-Relationship Diagram (ERD) solution extends ConceptDraw DIAGRAM software with templates, samples and libraries of vector stencils from drawing the ER-diagrams by Chen's and crow’s foot notations.
Data Flow Diagram Examples

Diagramming Software for Design UML Use Case Diagrams


Basic Circles Venn Diagram. Venn Diagram Example

This Venn Diagram shows the relative complement of the set A with respect to the set B. It is the set of the elements in B, but not in A. In other words it is the set-theoretic difference B-A.
UML Deployment Diagram
Use ConceptDraw DIAGRAM with UML deployment diagram templates, samples and stencil library from Rapid UML solution to model the physical deployment of artifacts on nodes of your software system.
Activity on Node Network Diagramming Tool

This sample shows the Activity on node network diagramming method. It was created in ConceptDraw DIAGRAM diagramming and vector drawing software using the Seven Management and Planning Tools solution from the Management area of ConceptDraw Solution Park.
UML Class Diagram Example - Buildings and Rooms

This sample shows the structure of the building and can be used by building companies, real estate agencies, at the buying / selling of the realty.
UML Use Case Diagram Example - Estate Agency
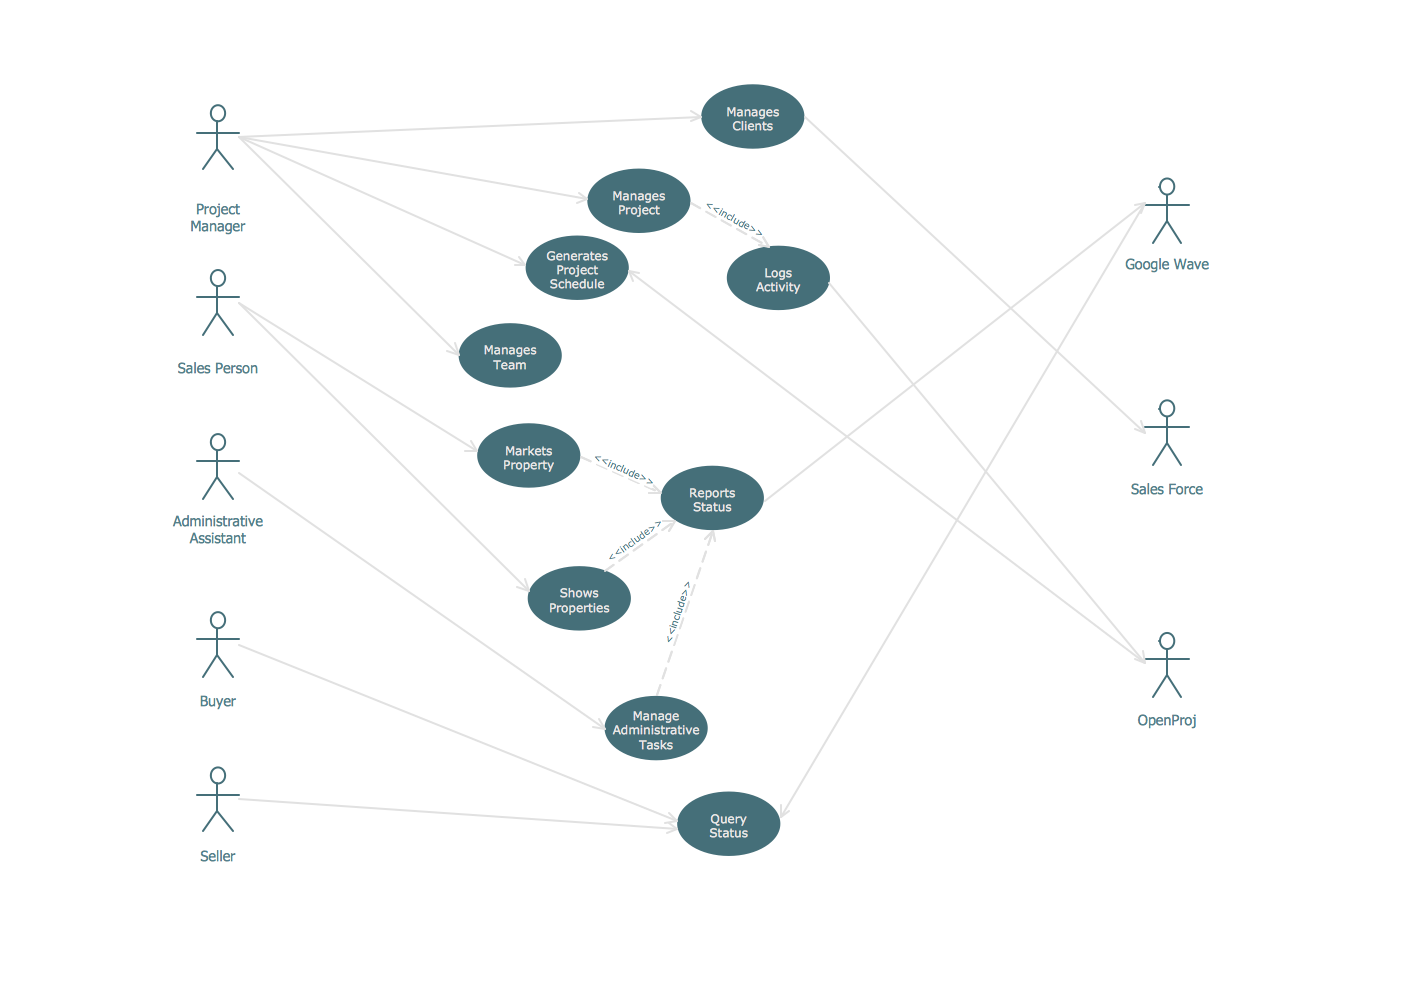
This sample shows the work of the estate agency and is used by the estate agencies, building companies, at the trainings of the estate agencies, for understanding the working processes of the estate agencies.
Relationships Analysis

The Seven Management and Planning Tools is a tool for Interaction diagram drawing. This diagram identifies causal relationships. Determine what factors are causes and which factors are effects. Interaction diagram helps establish KPIs to monitor changes and the effectiveness of corrective actions in resolving the problem.

Martin ERD Diagram

Venn Diagram Template for Word

Venn Diagram Examples for Problem Solving

Entity-Relationship Diagram (ERD) with ConceptDraw DIAGRAM

one-to-many, many-to-many.
Draw Entity-Relationship Diagrams (ERD) easily with ConceptDraw extended with Entity-Relationship Diagram (ERD) Solution from the Software Development Area. Use ERD software to create ER diagram.

- Venn Diagram Examples for Problem Solving. Environmental Social ...
- Example Of Diagramming Social Relationship
- Venn Diagram Examples for Problem Solving. Environmental Social ...
- Diagramming Social Relationships
- UML Use Case Diagram Example Social Networking Sites Project ...
- Martin ERD Diagram | UML Use Case Diagram Example Social ...
- UML Use Case Diagram Example Social Networking Sites Project ...
- Martin ERD Diagram | UML Use Case Diagram Example Social ...
- Relationship marketing | Venn diagram - Relationship marketing ...
- UML Use Case Diagram Example Social Networking Sites Project ...
- Venn Diagram Examples for Problem Solving. Environmental Social ...
- UML Use Case Diagram Example Social Networking Sites Project ...
- UML Use Case Diagram Example Social Networking Sites Project ...
- Venn Diagram Examples for Problem Solving. Environmental Social ...
- Venn Diagram Examples for Problem Solving. Environmental Social ...
- Relationship marketing | Six Markets Model Chart | Venn Diagram ...
- UML Use Case Diagram Example Social Networking Sites Project ...
- UML Use Case Diagram Example Social Networking Sites Project ...
- Business Process Diagrams | Entity- Relationship Diagram (ERD ...
- Entity- Relationship Diagram (ERD) | UML Use Case Diagram ...
- ERD | Entity Relationship Diagrams, ERD Software for Mac and Win
- Flowchart | Basic Flowchart Symbols and Meaning
- Flowchart | Flowchart Design - Symbols, Shapes, Stencils and Icons
- Flowchart | Flow Chart Symbols
- Electrical | Electrical Drawing - Wiring and Circuits Schematics
- Flowchart | Common Flowchart Symbols
- Flowchart | Common Flowchart Symbols