Using Fishbone Diagrams for Problem Solving

Using Fishbone Diagrams for Problem Solving is a productive and illustrative tool to identify the most important factors causing the trouble. ConceptDraw PRO extended with Fishbone Diagrams solution from the Management area of ConceptDraw Solution Park is a powerful tool for problem solving with Fishbone Ishikawa diagram graphic method.
Venn Diagram Examples for Problem Solving. Environmental Social Science. Human Sustainability Confluence

Create your Venn diagrams for problem solving in environmental social science using the ConceptDraw PRO diagramming and vector drawing software extended with the Venn Diagrams solution from the area "What is a Diagram" of ConceptDraw Solution Park.
Bar Diagrams for Problem Solving. Create event management bar charts with Bar Graphs Solution

Venn Diagram Examples for Problem Solving. Venn Diagram as a Truth Table

Venn Diagram Examples for Problem Solving. Computer Science. Chomsky Hierarchy

The Venn diagram example below visualizes the the class of language inclusions described by the Chomsky hierarchy.
Venn Diagram Examples for Problem Solving . Quantum Information Science. BQP Complexity

Cause and Effect Analysis - Fishbone Diagrams for Problem Solving

Bar Diagrams for Problem Solving. Create manufacturing and economics bar charts with Bar Graphs Solution

Bar Diagrams for Problem Solving. Create business management bar charts with Bar Graphs Solution

Bar Diagrams for Problem Solving. Create economics and financial bar charts with Bar Graphs Solution

Bar Diagrams for Problem Solving. Create space science bar charts with Bar Graphs Solution

Create bar graphs for visual solving your scientific problems and data comparison using the ConceptDraw PRO diagramming and vector drawing software extended with the Bar Graphs Solution from the Graphs and Charts area of ConceptDraw Solition Park.
Fishbone Problem Solving

ConceptDraw PRO diagramming and vector drawing software extended with Fishbone Diagrams Solution from the Management Area of ConceptDraw Solution Park is a powerful Fishbone Problem Solving tool.
"Problem-solving consists of using generic or ad hoc methods, in an orderly manner, for finding solutions to problems. Some of the problem-solving techniques developed and used in artificial intelligence, computer science, engineering, mathematics, medicine, etc. are related to mental problem-solving techniques studied in psychology." [Problem solving. Wikipedia]
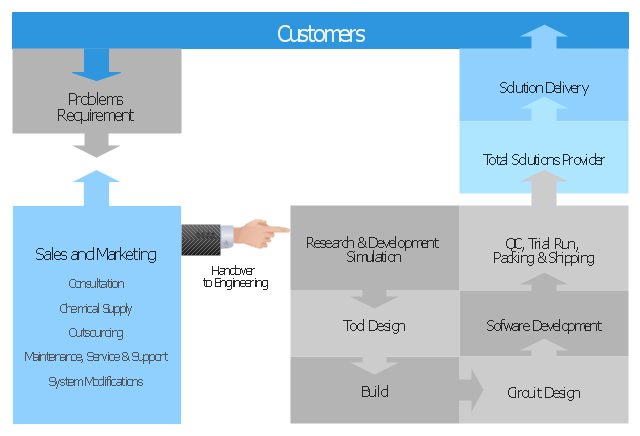
The block diagram example "Total solution process" was created using the ConceptDraw PRO diagramming and vector drawing software extended with the Block Diagrams solution from the area "What is a Diagram" of ConceptDraw Solution Park.
The block diagram example "Total solution process" was created using the ConceptDraw PRO diagramming and vector drawing software extended with the Block Diagrams solution from the area "What is a Diagram" of ConceptDraw Solution Park.
Block diagram
Fishbone Diagram Problem Solving

To design easily the Fishbone diagram, you can use a special ConceptDraw PRO vector graphic and diagramming software which contains the powerful tools for Fishbone diagram problem solving offered by Fishbone Diagrams solution for the Management area of ConceptDraw Solution Park.
Ishikawa Diagram

ConceptDraw PRO diagramming and vector drawing software extended with Fishbone Diagrams solution from the Management area can help you with construction the Fishbone Diagram also known as Ishikawa Diagram.
Ishikawa Diagram shows factors of Equipment, Process, People, Materials, Environment and Management, all affecting the overall problem in one drawing for the further analysis. It is a well effective way to analyze the business problems you must identify and solve.
"A root cause is an initiating cause of a causal chain which leads to an outcome or effect of interest. Commonly, root cause is used to describe the depth in the causal chain where an intervention could reasonably be implemented to change performance and prevent an undesirable outcome." [Root cause. Wikipedia]
"Problem-solving consists of using generic or ad hoc methods, in an orderly manner, for finding solutions to problems. Some of the problem-solving techniques developed and used in artificial intelligence, computer science, engineering, mathematics, medicine, etc. are related to mental problem-solving techniques studied in psychology." [Problem solving. Wikipedia]
This root cause analysis (RCA) tree diagram example "Personal problem solution" was created using the ConceptDraw PRO diagramming and vector drawing software extended with the Seven Management and Planning Tools solution from the Management area of ConceptDraw Solution Park.
Tree diagram

"Root cause analysis (RCA) is a method of problem solving that tries to identify the root causes of faults or problems.
RCA practice tries to solve problems by attempting to identify and correct the root causes of events, as opposed to simply addressing their symptoms. Focusing correction on root causes has the goal of preventing problem recurrence. RCFA (Root Cause Failure Analysis) recognizes that complete prevention of recurrence by one corrective action is not always possible.
Conversely, there may be several effective measures (methods) that address the root causes of a problem. Thus, RCA is an iterative process and a tool of continuous improvement.
RCA is typically used as a reactive method of identifying event(s) causes, revealing problems and solving them. Analysis is done after an event has occurred. Insights in RCA may make it useful as a preemptive method. In that event, RCA can be used to forecast or predict probable events even before they occur. While one follows the other, RCA is a completely separate process to Incident Management." [Root cause analysis. Wikipedia]
The root cause analysis (RCA) tree diagram example "Manufacturing problem solution" was created using the ConceptDraw PRO diagramming and vector drawing software extended with the solution "Seven Management and Planning Tools" from the Management area of ConceptDraw Solution Park.
Tree diagram

PERT Chart

 Seven Management and Planning Tools
Seven Management and Planning Tools solution extends ConceptDraw PRO and ConceptDraw MINDMAP with features, templates, samples and libraries of vector stencils for drawing management mind maps and diagrams.
Cause and Effect Diagram

- Using Fishbone Diagrams for Problem Solving | Cause and Effect ...
- Fishbone Problem Solving | Venn Diagram Examples for Problem ...
- Venn Diagram Examples for Problem Solving . Computer Science ...
- Venn Diagram Examples for Problem Solving . Venn Diagram as a
- Physics | Venn Diagram Examples for Problem Solving . Computer ...
- Venn Diagram Examples for Problem Solving . Environmental Social ...
- Bar Diagrams for Problem Solving . Create manufacturing and ...
- Bar Chart Examples | Bar Diagrams for Problem Solving . Create ...
- Bar Diagrams for Problem Solving . Create business management ...
- PROBLEM ANALYSIS Prioritization Matrix | PROBLEM ANALYSIS ...
- Fault Tree Analysis Diagrams | Root cause analysis tree diagram ...
- Bar Diagrams for Problem Solving . Create space science bar charts ...
- Venn Diagram Examples for Problem Solving . Venn Diagram as a ...
- Bar Diagrams for Problem Solving . Create economics and financial ...
- A Sample Diagram Of A Bar Graph
- Cause and Effect Analysis (Fishbone Diagrams ) | PROBLEM ...
- Root cause analysis tree diagram template
- Simple & Fast Diagram Software | Venn Diagram Examples for ...
- Venn Diagram Examples for Problem Solving in Computer Science
- Sales Growth. Bar Graphs Example | Bar Diagrams for Problem ...
- ERD | Entity Relationship Diagrams, ERD Software for Mac and Win
- Flowchart | Basic Flowchart Symbols and Meaning
- Flowchart | Flowchart Design - Symbols, Shapes, Stencils and Icons
- Flowchart | Flow Chart Symbols
- Electrical | Electrical Drawing - Wiring and Circuits Schematics
- Flowchart | Common Flowchart Symbols
- Flowchart | Common Flowchart Symbols