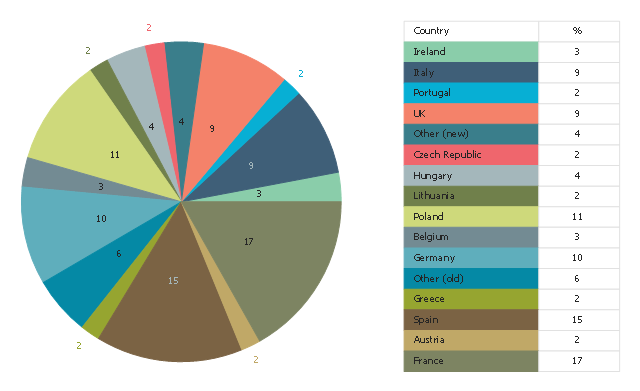
This pie chart sample shows the percentage of EU farm land by country. It was designed on the base of the Wikimedia Commons file: EUFarm-eng.svg. [commons.wikimedia.org/ wiki/ File:EUFarm-eng.svg]
"The agricultural sector is supported by subsidies from the European Union in the form of the Common Agricultural Policy (CAP). In 2013 this represented approximately €45billion (less than 33% of the overall budget of €148billion) of the EU's total spending. It was used originally to guarantee a minimum price for farmers in the EU. This is criticised as a form of protectionism, inhibiting trade, and damaging developing countries; one of the most vocal opponents is the UK, the second largest economy within the bloc, which has repeatedly refused to give up the annual UK rebate unless the CAP undergoes significant reform; France, the biggest beneficiary of the CAP and the bloc's third largest economy, is its most vocal proponent." [Economy of the European Union. Wikipedia]
The pie chart example "Percentage of EU farm land by country" was created using the ConceptDraw PRO diagramming and vector drawing software extended with the Pie Charts solutiton of the Graphs and Charts area in ConceptDraw Solution Park.
Pie chart
Scatter Graph Charting Software

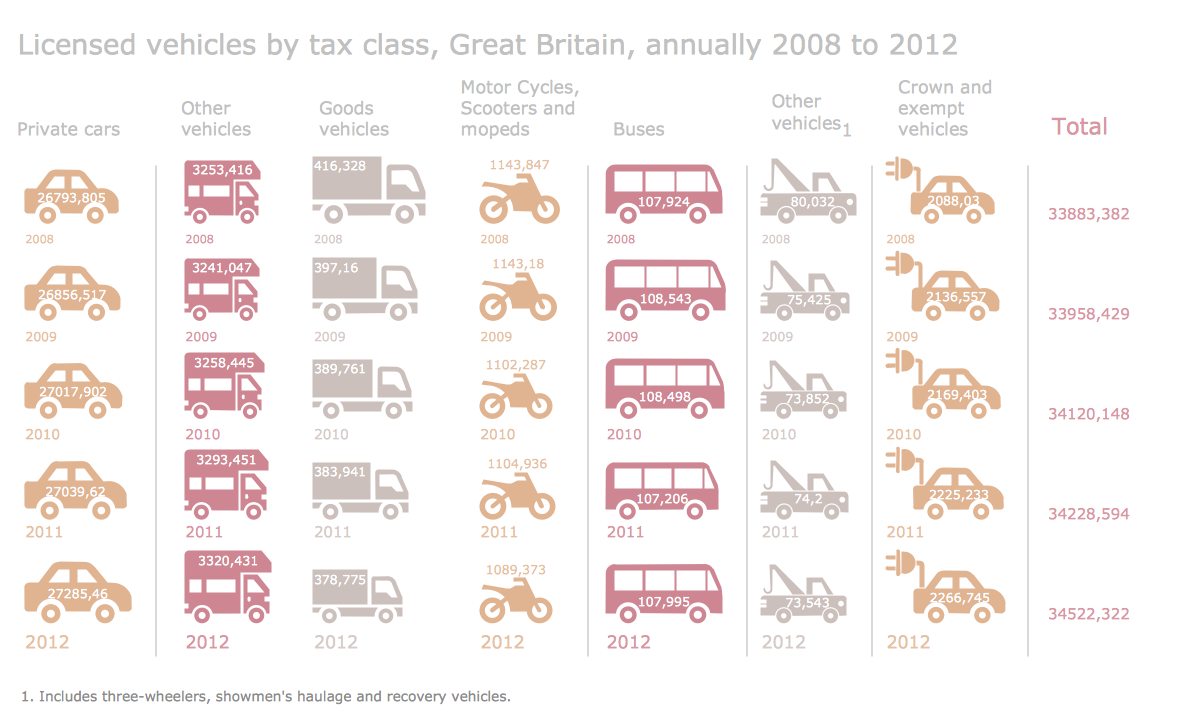
Sample Pictorial Chart. Sample Infographics

Use Pictorial Infographics solution to draw your own design pictorial infographics documents quick and easy.
 Marketing Diagrams
Marketing Diagrams solution extends ConceptDraw DIAGRAM diagramming software with abundance of samples, templates and vector design elements intended for easy graphical visualization and drawing different types of Marketing diagrams and graphs, including Branding Strategies Diagram, Five Forces Model Diagram, Decision Tree Diagram, Puzzle Diagram, Step Diagram, Process Chart, Strategy Map, Funnel Diagram, Value Chain Diagram, Ladder of Customer Loyalty Diagram, Leaky Bucket Diagram, Promotional Mix Diagram, Service-Goods Continuum Diagram, Six Markets Model Diagram, Sources of Customer Satisfaction Diagram, etc. Analyze effectively the marketing activity of your company and apply the optimal marketing methods with ConceptDraw DIAGRAM software.
 Education Package
Education Package is a comprehensive set of multifarious graphical solutions from ConceptDraw Solution Park, collected together in help to ConceptDraw DIAGRAM users working in a field of science, education and training, which is aimed at improving the quality of education and helping to design with ease variety of interesting and colorful educational materials, diagrams, charts and maps. Use it to present the information and knowledge in an interesting, clear, structured and simple form to achieve a success in education and pedagogy, to maintain the interest of students and pupils throughout the whole learning process, at the lectures, lessons and even during independent work with additional materials, to contribute to better perception of scientific information by listeners during the conferences and reports.
Information Graphics
 Genogram
Genogram solution including professionally designed genogram samples and a wide range of high-quality vector design elements of genogram symbols, medical genogram symbols, emotional relationships and family relationships, makes the ConceptDraw DIAGRAM software the best for drawing the informative Genograms, genealogy schematics and illustrations, and family tree of any depth, and for any quantity of generations. It perfectly suits for the medical specialists of different profiles, medical consultants, therapists, genetics, psychologists, and other medical professionals, each individual and couple.
 Picture Graphs
Typically, a Picture Graph has very broad usage. They many times used successfully in marketing, management, and manufacturing. The Picture Graphs Solution extends the capabilities of ConceptDraw DIAGRAM with templates, samples, and a library of professionally developed vector stencils for designing Picture Graphs.
Bar Diagrams for Problem Solving. Create economics and financial bar charts with Bar Graphs Solution

 Floor Plans
Construction, repair and remodeling of the home, flat, office, or any other building or premise begins with the development of detailed building plan and floor plans. Correct and quick visualization of the building ideas is important for further construction of any building.
- Area Charts | Pie Charts Of Agriculture In India
- Example Of Pie Diagram Related To Agriculture India
- Pie Charts | Pie Chart Of Indian Farming
- Area Charts | Bar Garph Chart Of Crop Production In India
- Area Charts | Education Package | Bar Graph Of Indian Agriculture
- Pie Chart With Example Of Agriculture
- Bar Chart Of Agriculture Production In India
- Pie Charts | Food Court | Picture Graph | Indian Resources Pie Chart
- Area Charts | Bar Graph Of Agriculture In India
- Pie Chart Of Irrigation Facilities In India
- ERD | Entity Relationship Diagrams, ERD Software for Mac and Win
- Flowchart | Basic Flowchart Symbols and Meaning
- Flowchart | Flowchart Design - Symbols, Shapes, Stencils and Icons
- Flowchart | Flow Chart Symbols
- Electrical | Electrical Drawing - Wiring and Circuits Schematics
- Flowchart | Common Flowchart Symbols
- Flowchart | Common Flowchart Symbols