Matrix Organization Structure

Now we have ConceptDraw DIAGRAM diagramming and vector drawing software extended with 25 Typical Orgcharts solution from the Management area of ConceptDraw Solution Park which will help easy represent matrix organizational structure of any degree of complexity.
 25 Typical Orgcharts
The 25 Typical Orgcharts solution contains powerful organizational structure and organizational management drawing tools, a variety of professionally designed organization chart and matrix organization structure samples, 25 templates based on various orga
TOWS Matrix

Deployment Chart Software

The Matrices solution offers you the useful tools for creating Deployment Charts in just minutes.
The Deployment Charts designed with ConceptDraw DIAGRAM are vector graphic documents and are available for reviewing, modifying, converting to a variety of formats (image, HTML, PDF file, MS PowerPoint Presentation, Adobe Flash or MS Visio XML), printing and send via e-mail in one moment.
Gant Chart in Project Management


BCG Matrix

Matrices
Ansoff Matrix

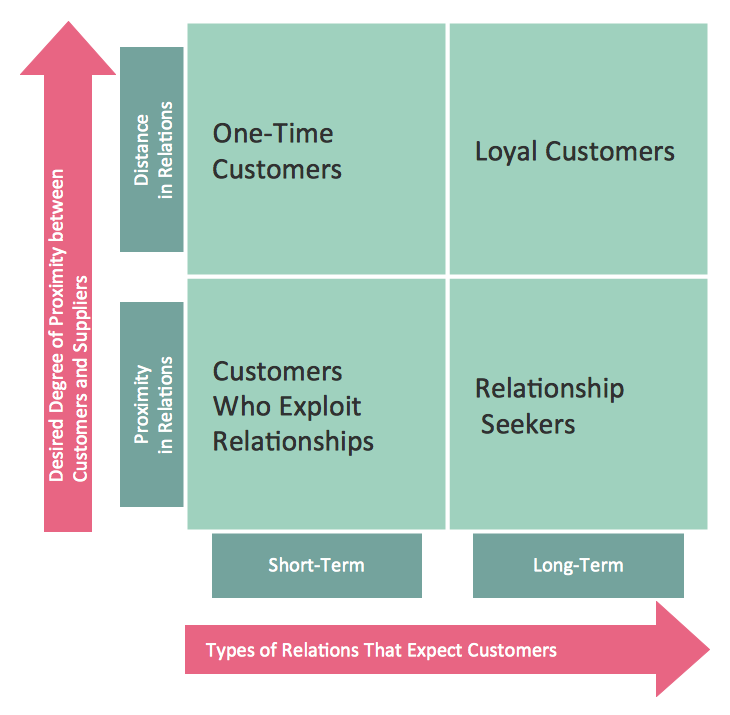
Positioning Map

SWOT Matrix

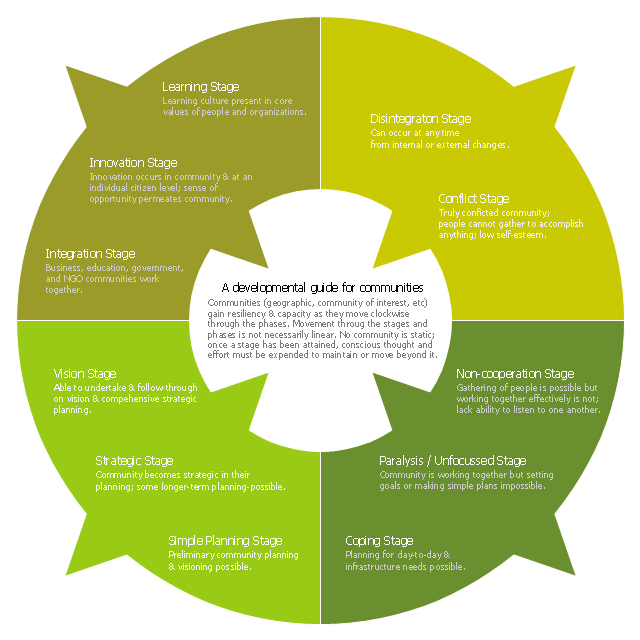
This ring chart sample was created on the base of the figure illustrating the "CCP Handbook - Comprehensive Community Planning for First Nations in British Columbia" from the Government of Canada website. "Tool 1: Centre for Innovative & Entrepreneurial Leadership (CIEL) Community Life Cycle Matrix.
Actualization Phase.
Community is highly developed and encourages learning & innovation while respecting history and culture. Community shares resources with others and regularly monitors itself, continuing to enhance capacity.
Action: Community undertakes regular reviews and reflection activities to maintain or enhance stage / phase.
Pre-Community or Chaos Phase.
Community is undeveloped. Limited sharing of resources or recognition of value of a community.
Action: Community can (re)form through the identification of and action of influential and respected leaders (elected or unelected).
Vision Phase.
Community recognizes the importance of vision and long-term planning; is able to move in this direction.
Action: Community can engage in planning, meaningful consultation of its members, & working towards the development of strategic thinking & planning, and, ultimately, identifying community-wide values, distinct community characteristics and a vision.
Emergence Phase.
Community exists but has significant problems, making anything but survival & fulfilling short-term needs impossible.
Action: Community can advance through focus on small, non-political, trustbuilding projects to build success, respect, confidence, relationships & skills.
Why the Matrix.
The challenge of developing innovative and entrepreneurial communities is in ensuring that the communities have a clear picture of where they are at and where they want to go. This enables a better match of the tools available with both the capacity of the community and the hoped for goal. For example, while strategic planning may work for some communities, the planning process may also lead to frustration and failure in other communities that do not have the necessary trust, social capital or capacity." [aadnc-aandc.gc.ca/ eng/ 1100100021972/ 1100100022090]
The ring chart example "Community life cycle matrix" was created using the ConceptDraw PRO diagramming and vector drawing software extended with the Target and Circular Diagrams solution from the Marketing area of ConceptDraw Solution Park.
www.conceptdraw.com/ solution-park/ marketing-target-and-circular-diagrams
Ring chart
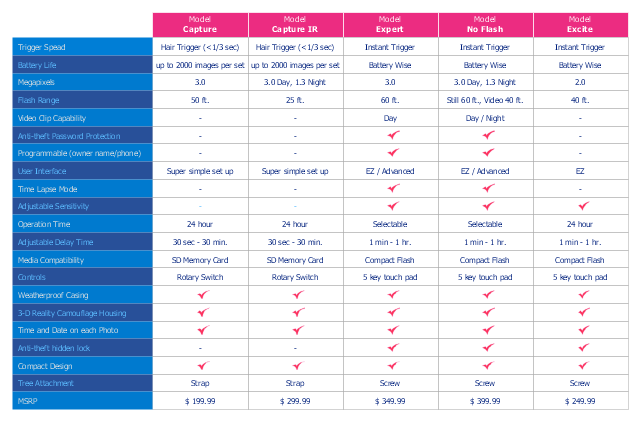
Competitive Feature Comparison Matrix is a tool to compare the features and functionality of competitive products or services in side-by-side table.
The feature comparison matrices are used for feature comparison analysis of competitive products and services.
This competitive feature comparison matrix chart example was created using the ConceptDraw PRO diagramming and vector drawing software extended with the Matrices solution from the Marketing area of ConceptDraw Solution Park.
Feature comparison chart
Matrix Organization

Pyramid Diagram and Pyramid Chart

Feature Comparison Chart Software

This sample shows the Feature Comparison Chart of the digital scouting cameras. It can be useful for digital cameras production field, marketing, sales, etc.
- Example Of A Matrix Chart
- Competitive feature comparison matrix chart - Digital scouting ...
- Matrix Organization Structure | Organizational Chart Template ...
- Comparative Matrix Example
- Matrix Flow Chart
- Functional Organizational Structure | Matrix Organization Structure ...
- Competitor Analysis | Competitive feature comparison matrix chart ...
- Matrix Chart Template
- Examples Of A Matrix Chart To Compare
- Examples of Flowcharts, Org Charts and More | Matrix Organization ...
- Circle-Spoke Diagrams | Community life cycle matrix - Ring chart ...
- Comparison Chart Example
- Competitor Analysis | Target and Circular Diagrams | Pyramid Chart ...
- Deployment Or Matrix Flow Chart Example
- Competitive feature comparison matrix chart - Digital scouting cameras
- How to Draw a Matrix Organizational Chart with ConceptDraw PRO
- Deployment Chart Software | Matrices | Business Tools Perceptual ...
- Matrix Organization Structure | Organizational Structure | Examples ...
- Feature Comparison Chart Software | Competitive feature ...
- How to Draw a Matrix Organizational Chart with ConceptDraw PRO ...
- ERD | Entity Relationship Diagrams, ERD Software for Mac and Win
- Flowchart | Basic Flowchart Symbols and Meaning
- Flowchart | Flowchart Design - Symbols, Shapes, Stencils and Icons
- Flowchart | Flow Chart Symbols
- Electrical | Electrical Drawing - Wiring and Circuits Schematics
- Flowchart | Common Flowchart Symbols
- Flowchart | Common Flowchart Symbols