How to Discover Critical Path on a Gantt Chart

Examples of Flowcharts, Org Charts and More


Activity Network Diagram Method

This sample shows the PERT (Program Evaluation Review Technique) chart of the request on proposal. A request for proposal (RFP) is a request of the company or the organization to potential suppliers to submit the business proposals for service or goods that it is interested to purchase. The RFP is represented on the initial procurement stage and allows to define the risks and benefits.
How To Plan and Implement Projects Faster

Construction Project Chart Examples
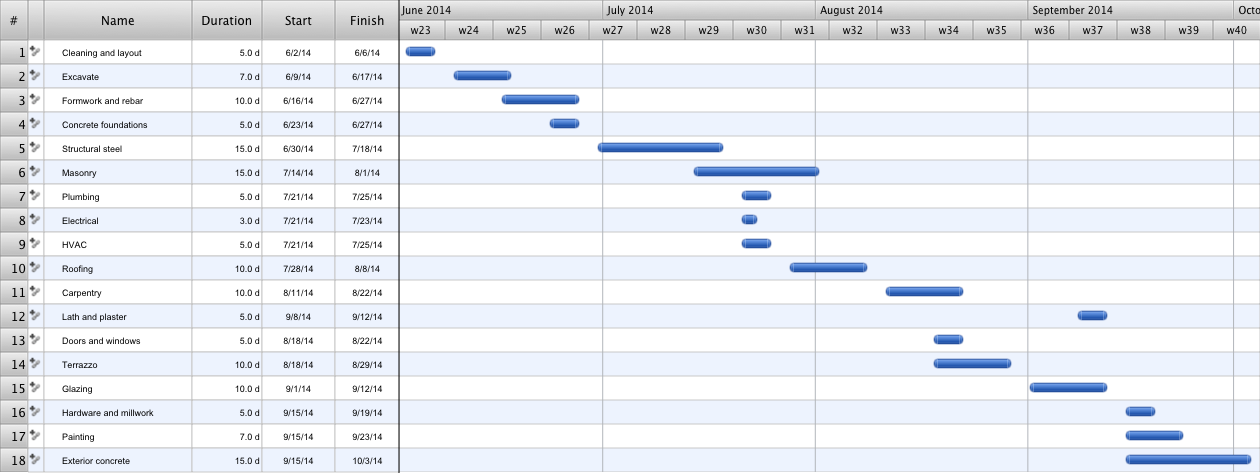
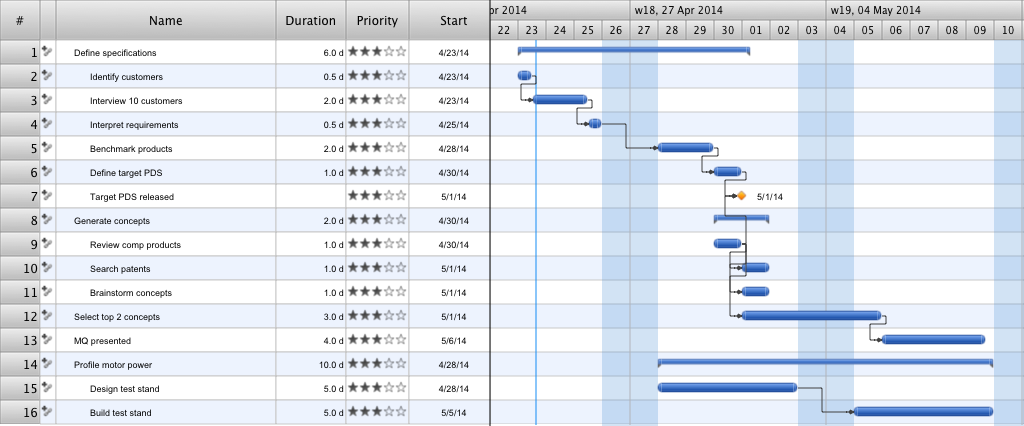
Gantt charts for planning and scheduling projects

Gantt Chart Templates
ConceptDraw PROJECT lets you the useful possibility to create visual project dashboards and diagrams, generate various kinds of reports with one click. It provides also extensive capabilities of importing and exporting in various formats: Microsoft Project, ConceptDraw MINDMAP , Mindjet MindManager, PDF file.
HelpDesk
How to Draw a Gantt Chart

HelpDesk
How to Create a Gantt Chart for Your Project

Gant Chart is a graphical representation of tasks as segments on a time scale. It helps plan or overlapping.
Activity Network (PERT) Chart

This diagram is constructed as part of the process in creating a schedule of corrective actions. The Activity Network Chart (PERT) shows the logical connections and consequence of tasks to be performed. It displays the time period for problem solving and the implementation of all activities through the critical path.
Gantt chart examples

Daily Schedule Chart

How to Create Presentation of Your Project Gantt Chart

Gantt Chart Software

Activity on Node Network Diagramming Tool

This sample shows the Activity on node network diagramming method. It was created in ConceptDraw DIAGRAM diagramming and vector drawing software using the Seven Management and Planning Tools solution from the Management area of ConceptDraw Solution Park.
- Chart On Project Proposal
- Examples of Flowcharts, Org Charts and More | Activity Network ...
- Gant Chart in Project Management | Gantt chart examples | Process ...
- Pert Chart Examples Project
- Activity Network Diagram Method | Gant Chart in Project ...
- Flow chart Example . Warehouse Flowchart | Activity Network ( PERT ...
- Sample Of Gantt Chart For Project Proposal
- Activity Network Diagram Method | Gantt Chart Software | Project ...
- Gantt Chart For Computer Network Project
- How to Draw a Gantt Chart Using ConceptDraw PRO | Examples of ...
- Activities In A Project Management Software With Example Diagram
- Project Management Charts And Graphs
- Activity Network Diagram Method | Process Flowchart | How to Draw ...
- Pert Diagram Example Project Management
- Activity Network Diagram Method | How to Draw a Gantt Chart Using ...
- Activity on Node Network Diagramming Tool | Activity Network ...
- Activity Network Chart In Softwrae Project Management
- Network Diagram Template For Project Management
- Gantt charts for planning and scheduling projects | How to Create ...
- How to Create Presentation of Your Project Gantt Chart | Gant Chart ...
- ERD | Entity Relationship Diagrams, ERD Software for Mac and Win
- Flowchart | Basic Flowchart Symbols and Meaning
- Flowchart | Flowchart Design - Symbols, Shapes, Stencils and Icons
- Flowchart | Flow Chart Symbols
- Electrical | Electrical Drawing - Wiring and Circuits Schematics
- Flowchart | Common Flowchart Symbols
- Flowchart | Common Flowchart Symbols