"Porter five forces analysis is a framework for industry analysis and business strategy development. It draws upon industrial organization (IO) economics to derive five forces that determine the competitive intensity and therefore attractiveness of a market. Attractiveness in this context refers to the overall industry profitability. An "unattractive" industry is one in which the combination of these five forces acts to drive down overall profitability. A very unattractive industry would be one approaching "pure competition", in which available profits for all firms are driven to normal profit.
Three of Porter's five forces refer to competition from external sources. The remainder are internal threats.
Porter referred to these forces as the micro environment, to contrast it with the more general term macro environment. They consist of those forces close to a company that affect its ability to serve its customers and make a profit. A change in any of the forces normally requires a business unit to re-assess the marketplace given the overall change in industry information. The overall industry attractiveness does not imply that every firm in the industry will return the same profitability. Firms are able to apply their core competencies, business model or network to achieve a profit above the industry average. A clear example of this is the airline industry. As an industry, profitability is low and yet individual companies, by applying unique business models, have been able to make a return in excess of the industry average.
Porter's five forces include - three forces from 'horizontal' competition: the threat of substitute products or services, the threat of established rivals, and the threat of new entrants; and two forces from 'vertical' competition: the bargaining power of suppliers and the bargaining power of customers.
This five forces analysis, is just one part of the complete Porter strategic models. The other elements are the value chain and the generic strategies." [Porter five forces analysis. Wikipedia]
The block diagram example "Porter's five forces model" was created using the ConceptDraw PRO diagramming and vector drawing software extended with the Block Diagrams solution from the area "What is a Diagram" of ConceptDraw Solution Park.
Block diagram

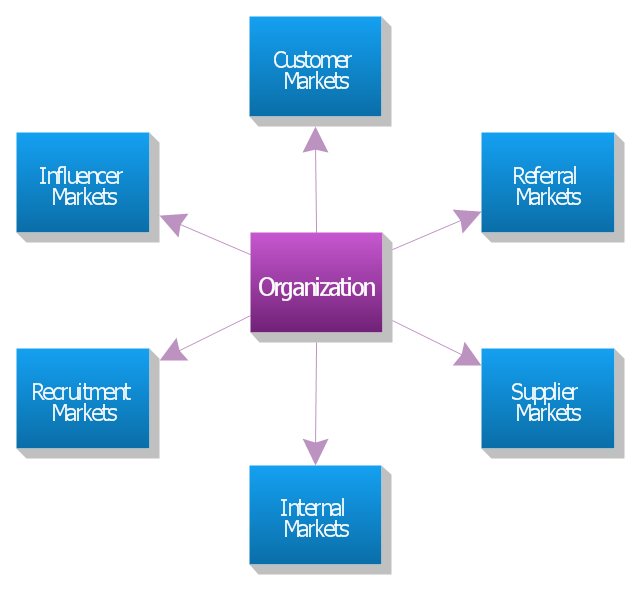
"The six markets model.
Christopher, Payne and Ballantyne (1991) from Cranfield University goes further. They identify six markets which they claim are central to relationship marketing. They are: internal markets, supplier markets, recruitment markets, referral markets, influence markets, and customer markets.
Referral marketing is developing and implementing a marketing plan to stimulate referrals. Although it may take months before you see the effect of referral marketing, this is often the most effective part of an overall marketing plan and the best use of resources.
Marketing to suppliers is aimed at ensuring a long-term conflict-free relationship in which all parties understand each other's needs and exceed each other's expectations. Such a strategy can reduce costs and improve quality.
Influence markets involve a wide range of sub-markets including: government regulators, standards bodies, lobbyists, stockholders, bankers, venture capitalists, financial analysts, stockbrokers, consumer associations, environmental associations, and labor associations. These activities are typically carried out by the public relations department, but relationship marketers feel that marketing to all six markets is the responsibility of everyone in the organization. Each market may require its own explicit strategies and a separate marketing mix for each." [Relationship marketing. Wikipedia]
The block diagram example "Six markets model" was created using the ConceptDraw PRO diagramming and vector drawing software extended with the Block Diagrams solution from the area "What is a Diagram" of ConceptDraw Solution Park.
Block diagram
 Block Diagrams
Block diagrams solution extends ConceptDraw PRO software with templates, samples and libraries of vector stencils for drawing the block diagrams.
"Dimensions of service quality.
A customer's expectation of a particular service is determined by factors such as recommendations, personal needs and past experiences. The expected service and the perceived service sometimes may not be equal, thus leaving a gap. The service quality model or the ‘GAP model’ developed by a group of authors- Parasuraman, Zeithaml and Berry at Texas and North Carolina in 1985 , highlights the main requirements for delivering high service quality. It identifies five ‘gaps’ that cause unsuccessful delivery. Customers generally have a tendency to compare the service they 'experience' with the service they 'expect' . If the experience does not match the expectation , there arises a gap. Ten determinants that may influence the appearance of a gap were described by Parasuraman, Zeithaml and Berry. in the SERVQUAL model: reliability, responsiveness, competence, access, courtesy, communication, credibility, security, understanding the customer and tangibles.
Later, the determinants were reduced to five: tangibles; reliability; responsiveness; service assurance and empathy in the so called RATER model." [Service quality. Wikipedia]
The block diagram example "Gap model of service quality" was created using the ConceptDraw PRO diagramming and vector drawing software extended with the Block Diagrams solution from the area "What is a Diagram" of ConceptDraw Solution Park.
Block diagram

Block Diagram

Use the libraries from the Block Diagrams solution to draw block diagrams for your business documents, presentations and websites in a few minutes.
Software Diagram Examples and Templates

Software Development area of ConceptDraw Solution Park provides 5 solutions:
Data Flow Diagrams, Entity-Relationship Diagram (ERD), Graphic User Interface, IDEFO Diagrams, Rapid UML.
Basic Diagramming

Use Basic Diagramming solution to draw you own diagrams, charts and graphs for graphic communication, explanation of business and personal ideas and concepts, simple visual presentation of numerical data, complex structures, logical relations, step-by-step flows of actions or operations.

Data Modeling Diagram

IDEF3 Standard

Entity-Relationship Diagram (ERD) with ConceptDraw PRO

one-to-many, many-to-many.
Draw Entity-Relationship Diagrams (ERD) easily with ConceptDraw extended with Entity-Relationship Diagram (ERD) Solution from the Software Development Area. Use ERD software to create ER diagram.

Express-G Diagram

Martin ERD Diagram

Types of Flowchart - Overview


Jacobson Use Cases Diagram

Business Diagram Software


ORM Diagram

SSADM Diagram

The example below illustrates the waterfall model used in SSADM. This model involves 5 stages of developing a product such as requirements specification and its' analysis, design, coding and testing.
"A document management system (DMS) is a computer system (or set of computer programs) used to track and store electronic documents. It is usually also capable of keeping track of the different versions modified by different users (history tracking). The term has some overlap with the concepts of content management systems. It is often viewed as a component of enterprise content management (ECM) systems and related to digital asset management, document imaging, workflow systems and records management systems. ...
Document management systems commonly provide storage, versioning, metadata, security, as well as indexing and retrieval capabilities." [Document management system. Wikipedia]
The block diagram example "Document management system architecture" was created using the ConceptDraw PRO diagramming and vector drawing software extended with the Block Diagrams solution from the area "What is a Diagram" of ConceptDraw Solution Park.
System architecture diagram

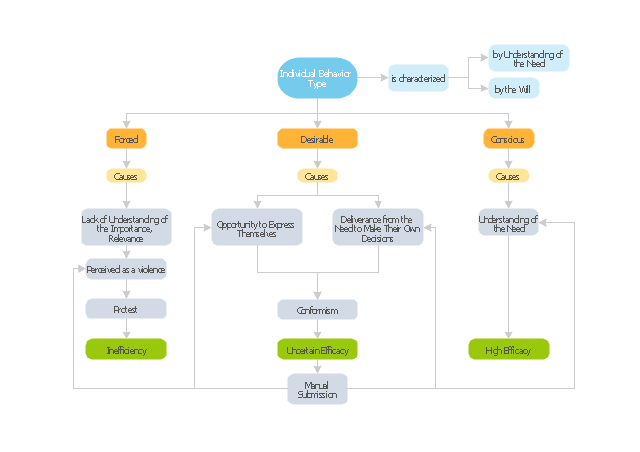
"Organizational behavior is a field of study that investigates the impact that individuals, groups and structures have on behavior within an organization for the purpose of applying such knowledge towards improving an organization's effectiveness. It is an interdisciplinary field that includes sociology, psychology, communication, and management; and it complements the academic studies of organizational theory (which is focused on organizational and intra-organizational topics) and human resource studies (which is more applied and business-oriented). It may also be referred to as organizational studies or organizational science." [Organizational behavior. Wikipedia]
The block diagram example "Types of individual behavior in organization" was created using the ConceptDraw PRO diagramming and vector drawing software extended with the Block Diagrams solution from the area "What is a Diagram" of ConceptDraw Solution Park.
The block diagram example "Types of individual behavior in organization" was created using the ConceptDraw PRO diagramming and vector drawing software extended with the Block Diagrams solution from the area "What is a Diagram" of ConceptDraw Solution Park.
Block diagram
Chen ERD Diagram

- Pyramid Diagram | Pyramid Chart Examples | Block diagram - Five ...
- Block diagram - Gap model of service quality | Business Process ...
- Block diagram - Five forces model
- Block diagram - Six markets model
- Block diagram - Gap model of service quality
- Block diagram - Five forces model - Conceptdraw.com
- 5 level pyramid model diagram of information systems types ...
- Block diagram - Gap model of service quality | Business diagrams ...
- Block diagram - Gap model of service quality
- Block diagram - Porter's five forces model |
- Basic Diagramming | Block Diagrams | Create Block Diagram |
- Block diagram - Porter's five forces model | Marketing | Marketing ...
- Event-driven Process Chain Diagrams EPC | Block diagram ...
- Block Diagrams | UML Class Diagram Example - Apartment Plan ...
- 3D Network Diagram Software | Pyramid Diagram | 3D block ...
- Block Diagrams | Basic Diagramming | Universal Diagramming Area |
- Block diagram - Six markets model |
- 3D block diagram template - Conceptdraw.com
- Block diagram - Six markets model | Marketing Diagrams |
- Block Diagrams | IDEF0 standard with ConceptDraw PRO | ER ...
- ERD | Entity Relationship Diagrams, ERD Software for Mac and Win
- Flowchart | Basic Flowchart Symbols and Meaning
- Flowchart | Flowchart Design - Symbols, Shapes, Stencils and Icons
- Flowchart | Flow Chart Symbols
- Electrical | Electrical Drawing - Wiring and Circuits Schematics
- Flowchart | Common Flowchart Symbols
- Flowchart | Common Flowchart Symbols