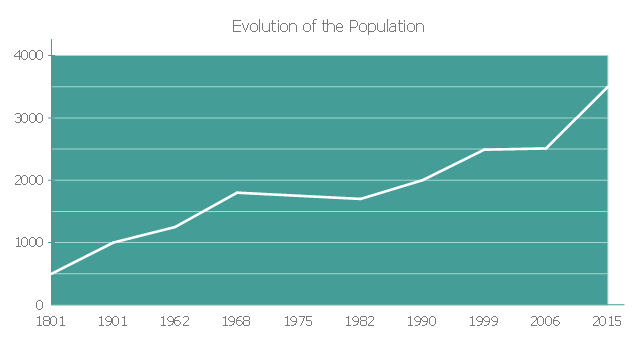
This line chart example showing evolution of the population from 1801 till nowadays was redesigned from the Wikimedia Commons file:
Evolution de la population vertoise 1801 maintenant.JPG
[commons.wikimedia.org/ wiki/ File:Evolution_ de_ la_ population_ vertoise_ 1801_ maintenant.JPG].
"Evolution is the change in the inherited characteristics of biological populations over successive generations. Evolutionary processes give rise to diversity at every level of biological organisation, including species, individual organisms and molecules such as DNA and proteins.
All life on Earth is descended from a last universal ancestor that lived approximately 3.8 billion years ago. Repeated speciation and the divergence of life can be inferred from shared sets of biochemical and morphological traits, or by shared DNA sequences. These homologous traits and sequences are more similar among species that share a more recent common ancestor, and can be used to reconstruct evolutionary histories, using both existing species and the fossil record. Existing patterns of biodiversity have been shaped both by speciation and by extinction." [Evolution. Wikipedia]
The line graph example "Evolution of the population" was created using the ConceptDraw PRO diagramming and vector drawing software extended with the Line Graphs solution from the Graphs and Charts area of ConceptDraw Solution Park.
www.conceptdraw.com/ solution-park/ charts-line-graphs
Line Chart Examples

Chart Examples

- Line chart - Evolution of the population | Line Chart Examples | Basic ...
- Line Chart Examples | Line chart - Evolution of the population | Area ...
- Line Chart Examples | How to Create a Line Chart | Line Graph ...
- Bio Flowchart Lite | Biology | Line chart - Evolution of the population |
- Line Graph Charting Software - Conceptdraw.com
- Line Chart Examples
- Line Chart Examples | Chart Examples | Picture graph - Population ...
- Line Chart Examples | Chart Examples | Picture Graphs |
- Line Chart Examples | Chart Examples | Basic Diagramming |
- Timeline Diagrams | Line Chart Examples | Line Graph Charting ...
- Line Graphs | Line Graph Charting Software | Line graph template |
- Create Graphs and Charts | Line Graph Charting Software | Marketing |
- How to Create a Scatter Chart | Scatter Chart Examples | Line Graph ...
- Line Graph Charting Software | Bar Chart Software | Column Chart ...
- Create Graphs and Charts | Line Graph Charting Software ...
- Line Chart Examples | Chart Examples | Examples of Flowcharts ...
- Line Chart Examples
- The Best Drawing Program for Mac | Scatter Chart Examples | Line ...
- Line Graph Charting Software | Basic Diagramming | How to Create ...
- Line graph template | Line Graph Charting Software | Line Graphs |
- ERD | Entity Relationship Diagrams, ERD Software for Mac and Win
- Flowchart | Basic Flowchart Symbols and Meaning
- Flowchart | Flowchart Design - Symbols, Shapes, Stencils and Icons
- Flowchart | Flow Chart Symbols
- Electrical | Electrical Drawing - Wiring and Circuits Schematics
- Flowchart | Common Flowchart Symbols
- Flowchart | Common Flowchart Symbols