How to Build Cloud Computing Diagram Principal Cloud Manufacturing

For documenting the Cloud Computing Architecture with a goal to facilitate the communication between stakeholders are successfully used the Cloud Computing Architecture diagrams. It is convenient and easy to draw various Cloud Computing Architecture diagrams in ConceptDraw DIAGRAM software with help of tools of the Cloud Computing Diagrams Solution from the Computer and Networks Area of ConceptDraw Solution Park.
HelpDesk
How to Create an AWS Architecture Diagram
 Plan-Do-Check-Act (PDCA)
Plan-Do-Check-Act (PDCA) solution extends the ConceptDraw DIAGRAM software with collection of samples and predesigned vector objects for easy visualization four stages of PDCA cycle, PDSA cycle, or Deming cycle, for illustration effective application of this method to the practical business tasks, for depiction the implementation of changes and solution the problems in business processes. Plan-Do-Check-Act (PDCA) solution helps to design professional-looking and attractive Plan Do Study Act diagrams, PDCA cycle diagrams, PDCA Process diagrams, and to construct the Quality Management Process Models, which all assist to manage efficiently the business processes, to improve quality of work and to reduce significantly the costs.
Entity Relationship Diagram Examples

ConceptDraw gives the ability to describe a database using the Entity-Relationship model. Entity-Relationship Diagram solution includes icons advocated by Chen's and Crow’s Foot notation that can be used when describing a database.

Flowchart design. Flowchart symbols, shapes, stencils and icons

Mavericks have always desired to stand apart and gorgeous design is the recipe for that. Any business graphic document will be more understandable if will use an expository color scheme for their parts. Flowchart design makes versatile presenting and explaining of the process and gives a fresh view that distinguishes it from black and white flowcharts on a paper. Workflow diagram or process flow diagrams become more understandable to ordinary people when it use minimum symbols and special signs.
The best design can be accomplished by starting from any of the suitable Conceptdraw examples. Pick one of them and begin to input proper text into each Flowchart symbols and shapes. Apply less colors in the document and don't turn into rainbow your diagram, three or four will be enough, also note that business process flowchart may not contain bright color hues. The next clue is to use identical colors for same flowchart shape types.

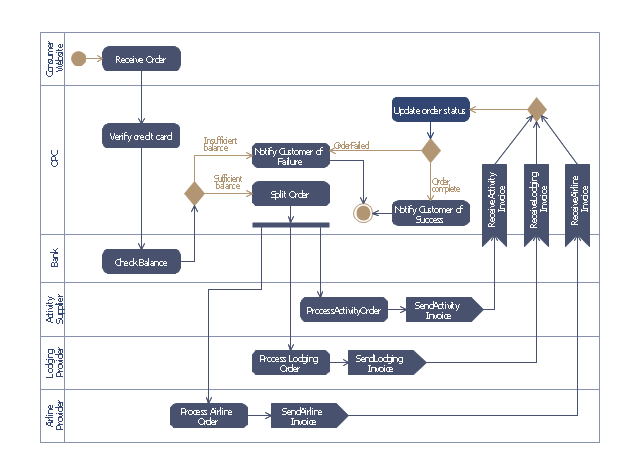
This purchase order processing UML activity diagram was created on the base of activity diagram from the software architecture documentation wiki of the Software Engineering Institute (SEI) of Carnegie Mellon University (CMU).
[wiki.sei.cmu.edu/ sad/ index.php/ Image:PurchaseOrderActivityDiagram.png]
"A purchase order (PO) is a commercial document and first official offer issued by a buyer to a seller, indicating types, quantities, and agreed prices for products or services. Acceptance of a purchase order by a seller forms a contract between the buyer and seller, so no contract exists until the purchase order is accepted. It is used to control the purchasing of products and services from external suppliers.
Creating a purchase order is typically the first step of the purchase to pay process in an ERP system." [Purchase order. Wikipedia]
This purchase order processing UML activity diagram example was created using the ConceptDraw PRO diagramming and vector drawing software extended with the ATM UML Diagrams solution from the Software Development area of ConceptDraw Solution Park.
UML activity diagram of purchase order processing
"Microsoft SharePoint is a Web application platform developed by Microsoft. First launched in 2001, SharePoint has historically been associated with intranet, content management and document management, but recent versions have significantly broader capabilities.
SharePoint comprises a multipurpose set of Web technologies backed by a common technical infrastructure. By default, SharePoint has a Microsoft Office-like interface, and it is closely integrated with the Office suite. The web tools are designed to be usable by non-technical users. SharePoint can be used to provide intranet portals, document & file management, collaboration, social networks, extranets, websites, enterprise search, and business intelligence. It also has system integration, process integration, and workflow automation capabilities.
Enterprise application software (e.g. ERP or CRM packages) often provide some SharePoint integration capability, and SharePoint also incorporates a complete development stack based on web technologies and standards-based APIs. As an application platform, SharePoint provides central management, governance, and security controls for implementation of these requirements. The SharePoint platform integrates directly into IIS - enabling bulk management, scaling, and provisioning of servers, as is often required by large organizations or cloud hosting providers." [Microsoft SharePoint. Wikipedia]
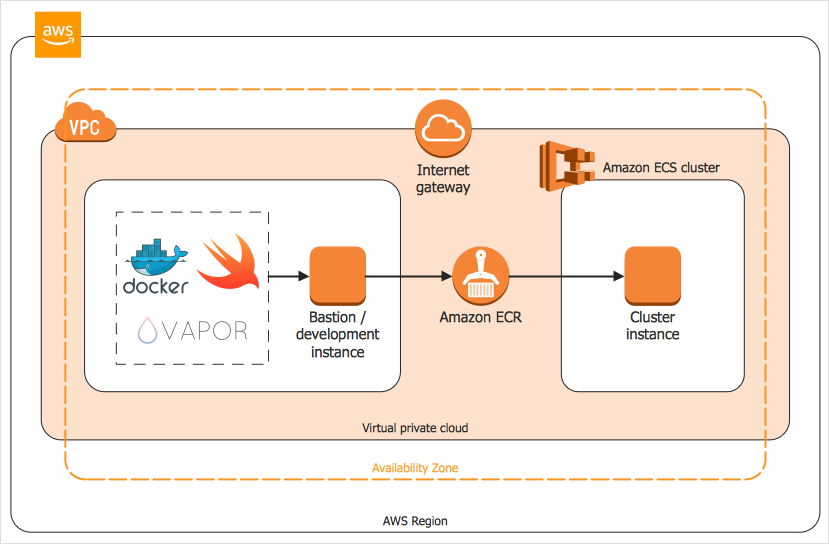
The AWS architecture diagram example "SharePoint server reference architecture for public-facing website scenario" was created using the ConceptDraw PRO diagramming and vector drawing software extended with the AWS Architecture Diagrams solution from the Computer and Networks area of ConceptDraw Solution Park.
SharePoint comprises a multipurpose set of Web technologies backed by a common technical infrastructure. By default, SharePoint has a Microsoft Office-like interface, and it is closely integrated with the Office suite. The web tools are designed to be usable by non-technical users. SharePoint can be used to provide intranet portals, document & file management, collaboration, social networks, extranets, websites, enterprise search, and business intelligence. It also has system integration, process integration, and workflow automation capabilities.
Enterprise application software (e.g. ERP or CRM packages) often provide some SharePoint integration capability, and SharePoint also incorporates a complete development stack based on web technologies and standards-based APIs. As an application platform, SharePoint provides central management, governance, and security controls for implementation of these requirements. The SharePoint platform integrates directly into IIS - enabling bulk management, scaling, and provisioning of servers, as is often required by large organizations or cloud hosting providers." [Microsoft SharePoint. Wikipedia]
The AWS architecture diagram example "SharePoint server reference architecture for public-facing website scenario" was created using the ConceptDraw PRO diagramming and vector drawing software extended with the AWS Architecture Diagrams solution from the Computer and Networks area of ConceptDraw Solution Park.
AWS architecture diagram

Business process Flow Chart — Event-Driven Process chain (EPC) diagrams

UML Notation

Two types of diagrams are used in UML: Structure Diagrams and Behavior Diagrams. Behavior Diagrams represent the processes proceeding in a modeled environment. Structure Diagrams represent the elements that compose the system.
Entity Relationship Diagram Software Engineering

Professional ERD drawing is an essential software engineering method for database modeling. ConceptDraw DIAGRAM as a powerful Entity Relationship Diagram Software Engineering offers the tools of Entity-Relationship Diagram (ERD) solution from Software Development area of ConceptDraw Solution Park.
- Erp System Architecture Diagram
- Draw The Flow Diagram For Erp System
- Erp Systems
- Process Flowchart | Block Diagram Of Non Erp Server
- Erp Architecture Diagram
- Block diagram - Document management system architecture ...
- Sample Architecture Diagrams For Erp Applications
- Erp Functional Block Diagram
- Activity Diagram For Order Processing System
- Flow Chart Symbols | ERD Symbols and Meanings | UML Object ...
- ERD | Entity Relationship Diagrams, ERD Software for Mac and Win
- Flowchart | Basic Flowchart Symbols and Meaning
- Flowchart | Flowchart Design - Symbols, Shapes, Stencils and Icons
- Flowchart | Flow Chart Symbols
- Electrical | Electrical Drawing - Wiring and Circuits Schematics
- Flowchart | Common Flowchart Symbols
- Flowchart | Common Flowchart Symbols