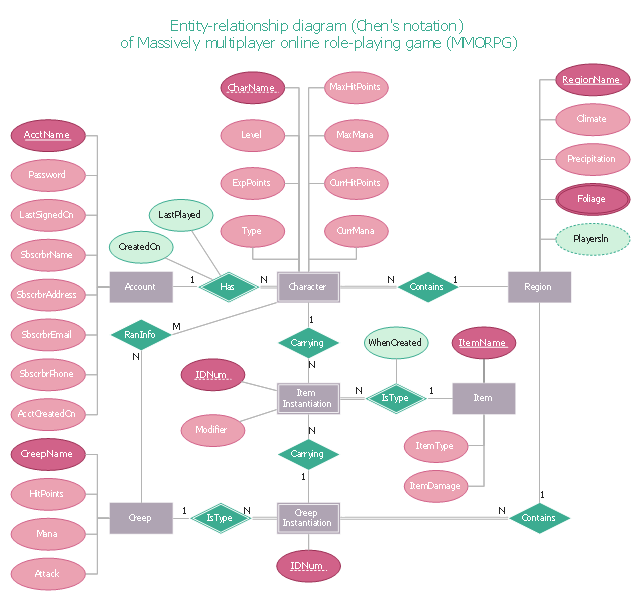
"In software engineering, an entity–relationship model (ER model) is a data model for describing a database in an abstract way.Chen's notation for entity–relationship modeling uses rectangles to represent entity sets, and diamonds to represent relationships appropriate for first-class objects: they can have attributes and relationships of their own. If an entity set participates in a relationship set, they are connected with a line.
Attributes are drawn as ovals and are connected with a line to exactly one entity or relationship set." [Entity–relationship model. Wikipedia]
This sample Chen's ER-diagram illustrates the structure of a typical MMORP game.
"Massively multiplayer online role-playing game (MMORPG) mixes the genres of role-playing video games and Massively multiplayer online games, possibly in the form of web browser-based games, in which a very large number of players interact with one another within a virtual world.
As in all RPGs, players assume the role of a character (often in a fantasy world or science-fiction world) and take control over many of that character's actions. MMORPGs are distinguished from single-player or small multi-player online RPGs by the number of players, and by the game's persistent world (usually hosted by the game's publisher), which continues to exist and evolve while the player is offline and away from the game." [Massively multiplayer online role-playing game. Wikipedia]
This ERD example was redrawn using the ConceptDraw PRO diagramming and vector drawing software from the Wikipedia file: ER Diagram MMORPG.png. [en.wikipedia.org/ wiki/ File:ER_ Diagram_ MMORPG.png]
This file is licensed under the Creative Commons Attribution-Share Alike 3.0 Unported license. [creativecommons.org/ licenses/ by-sa/ 3.0/ deed.en]
This Chen's ERD example is included in the Entity-Relationship Diagram (ERD) solution from the Software Development area of ConceptDraw Solution Park.
Chen's ERD
"Crow's Foot notation is used in Barker's Notation, SSADM and Information Engineering. Crow's Foot diagrams represent entities as boxes, and relationships as lines between the boxes. Different shapes at the ends of these lines represent the cardinality of the relationship." [Entity–relationship model. Wikipedia]
The vector stencils library ERD, crow's foot notation contains 17 symbols for creating the ER-diagrams using the ConceptDraw PRO diagramming nd vector drawing software.
The example"Design elements - ERD solution (crow's foot notation)" is included in the Entity-Relationship Diagram (ERD) solution from the Software Development area of ConceptDraw Solution Park.
Crow's foot ERD
.png--diagram-flowchart-example.png)
 Entity-Relationship Diagram (ERD)
Entity-Relationship Diagram (ERD) solution extends ConceptDraw PRO software with templates, samples and libraries of vector stencils from drawing the ER-diagrams by Chen's and crow’s foot notations.
 Crow’s Foot Notation
Crow’s Foot Notation solution extends ConceptDraw PRO software with powerful drawing tools, samples and library of predesigned vector Crow's Foot notation icons to help you easy describe the databases using the Entity-Relationship models and design professional-looking ER diagrams based on the popular Crow's Foot notation.
 People
This solution extends ConceptDraw PRO software with samples, templates and libraries of vector clipart for drawing the People illustrations. Use it to make professional-looking documents, presentations and websites illustrated with color scalable vector c
 Event-driven Process Chain Diagrams
Event-driven Process Chain (EPC) Diagram is a type of flowchart widely used for modeling in business engineering and reengineering, business process improvement, and analysis. EPC method was developed within the Architecture of Integrated Information Systems (ARIS) framework.
- Er Diagram Symbols Wiki
- Entity Relationship Diagram Wiki
- Erd Wiki
- Er Diagram Wiki
- Mobile Banking ER Diagram Wikipedia
- Chen Notation | Design elements - ER diagram (Chen notation ...
- ERD Symbols and Meanings | Chen notation ERD of MMORPG ...
- Er Diagram And Its Various Notation In Wikipedia
- Entity Relationship Diagram - ERD - Software for Design Crows Foot ...
- Commonly Used Er Diagram Symbols Wikipedia
- Chen's ERD of MMORPG | Design elements - ERD (crow's foot ...
- Chen's ERD of MMORPG | Contoh Erd Game Rpg
- Dfd Symbols Wiki
- Bubble Diagram Wiki
- ConceptDraw PRO ER Diagram Tool | Chen's ERD of MMORPG | Er ...
- Chen's ERD of MMORPG | Gane Sarson Diagram | Example of DFD ...
- Chen's ERD of MMORPG | ER Diagram for Cloud Computing | UML ...
- Chen's ERD of MMORPG | Erd For Multiplayer
- Chen's ERD of MMORPG | Entity-Relationship Diagram ( ERD ...
- Builder design pattern sequence | Chen's ERD of MMORPG ...
- ERD | Entity Relationship Diagrams, ERD Software for Mac and Win
- Flowchart | Basic Flowchart Symbols and Meaning
- Flowchart | Flowchart Design - Symbols, Shapes, Stencils and Icons
- Flowchart | Flow Chart Symbols
- Electrical | Electrical Drawing - Wiring and Circuits Schematics
- Flowchart | Common Flowchart Symbols
- Flowchart | Common Flowchart Symbols