 Entity-Relationship Diagram (ERD)
An Entity-Relationship Diagram (ERD) is a visual presentation of entities and relationships. That type of diagrams is often used in the semi-structured or unstructured data in databases and information systems. At first glance ERD is similar to a flowch
UML Use Case Diagram Example. Social Networking Sites Project

This sample shows the Facebook Socio-health system and is used at the projection and creating of the social networking sites.
Martin ERD Diagram

UML Diagram of Parking

UML Diagram of Parking - This diagram can be used for understanding the process of working the car parking, at the projection and construction the parking by building companies and for automation the existing parkings.
Activity on Node Network Diagramming Tool

This sample shows the Activity on node network diagramming method. It was created in ConceptDraw DIAGRAM diagramming and vector drawing software using the Seven Management and Planning Tools solution from the Management area of ConceptDraw Solution Park.
 Entity-Relationship Diagram (ERD)
Entity-Relationship Diagram (ERD) solution extends ConceptDraw DIAGRAM software with templates, samples and libraries of vector stencils from drawing the ER-diagrams by Chen's and crow’s foot notations.
ConceptDraw DIAGRAM Compatibility with MS Visio

 Metro Map
Metro Map solution extends ConceptDraw DIAGRAM software with templates, samples and library of vector stencils for drawing the metro maps, route maps, bus and other transport schemes, or design tube-style infographics.
HelpDesk
How to Create an Entity-Relationship Diagram

UML Class Diagram Example - Buildings and Rooms

This sample shows the structure of the building and can be used by building companies, real estate agencies, at the buying / selling of the realty.
Software development with ConceptDraw DIAGRAM

HelpDesk
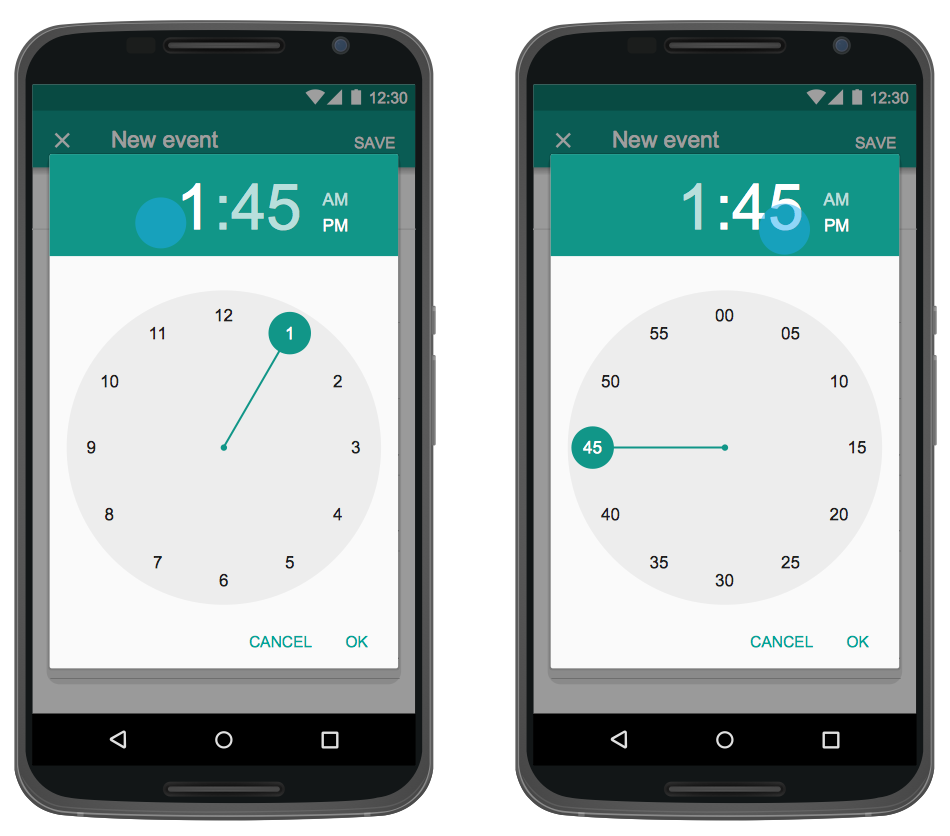
How to Design an Interface Mock-up of an Android Application
 Wireless Networks
The Wireless Networks Solution extends ConceptDraw DIAGRAM software with professional diagramming tools, set of wireless network diagram templates and samples, comprehensive library of wireless communications and WLAN objects to help network engineers and designers efficiently design and create Wireless network diagrams that illustrate wireless networks of any speed and complexity, and help to identify all required equipment for construction and updating wireless networks, and calculating their costs.
 Interactive Voice Response Diagrams
Interactive Voice Response Diagrams solution extends ConceptDraw DIAGRAM software with samples, templates and libraries of ready-to-use vector stencils that help create Interactive Voice Response (IVR) diagrams illustrating in details a work of interactive voice response system, the IVR system’s logical and physical structure, Voice-over-Internet Protocol (VoIP) diagrams, and Action VoIP diagrams with representing voice actions on them, to visualize how the computers interact with callers through voice recognition and dual-tone multi-frequency signaling (DTMF) keypad inputs.
HelpDesk
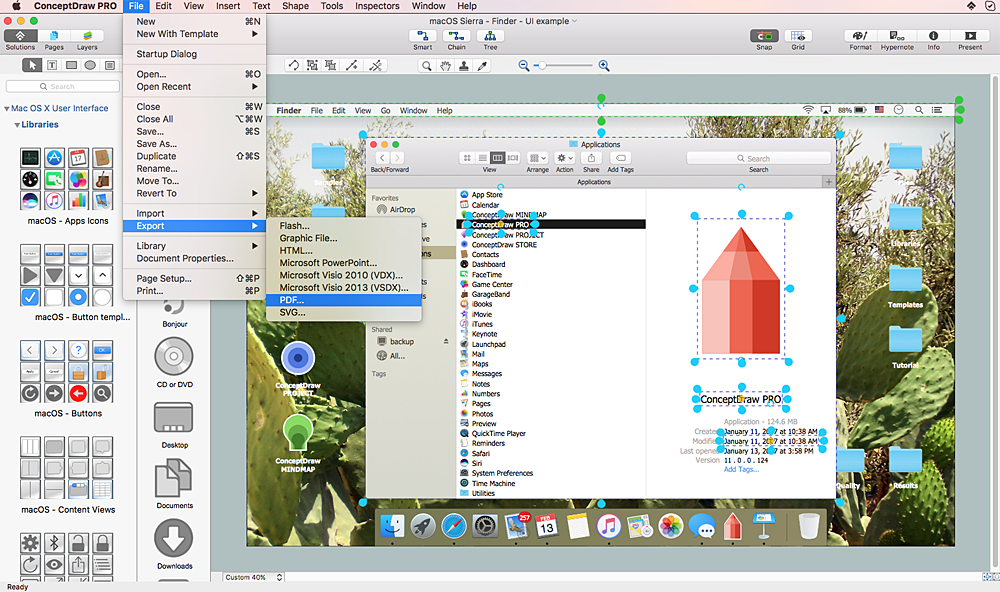
How to Design a Mockup of Apple macOS Sierra GUI
- Er Diagram Of Social Networking Site Pdf
- Social Networking Sites Diagrams Pdf
- Social Network Project For Dfd And Er Diagram Pdf
- Pdf Entity Relationship Diagram For Social Networking Website
- Dfd For Social Networking Site Pdf
- Dataflow Diagram For Social Network Site Pdf
- Uml Diagrams For Social Networking Site Pdf
- Social Media Uml Diagrams ER Diagrams Pdf
- Social Networking Site Class Diagrams Pdf
- A Social Netword Er Diagram Pdf
- Enchanced Entity Relationship Diagram For Social Networking Sites
- UML Use Case Diagram Example Social Networking Sites Project ...
- Entity-Relationship Diagram ( ERD ) | Metro Map | iPhone User ...
- Er Diagram Banking System Pdf
- Erd Examples With Scenarios Pdf
- How to Create a Social Media DFD Flowchart | Example of DFD for ...
- Entity-Relationship Diagram ( ERD ) | ConceptDraw PRO ER ...
- Diagramming Software for Design UML Use Case Diagrams
- How To Convert a Computer Network Diagram to Adobe PDF Using ...
- Online Secure Image Social Network Data Flow Doagraam Pdf
- ERD | Entity Relationship Diagrams, ERD Software for Mac and Win
- Flowchart | Basic Flowchart Symbols and Meaning
- Flowchart | Flowchart Design - Symbols, Shapes, Stencils and Icons
- Flowchart | Flow Chart Symbols
- Electrical | Electrical Drawing - Wiring and Circuits Schematics
- Flowchart | Common Flowchart Symbols
- Flowchart | Common Flowchart Symbols