 Entity-Relationship Diagram (ERD)
An Entity-Relationship Diagram (ERD) is a visual presentation of entities and relationships. That type of diagrams is often used in the semi-structured or unstructured data in databases and information systems. At first glance ERD is similar to a flowch
 Venn Diagrams
Venn Diagrams are actively used to illustrate simple set relationships in set theory and probability theory, logic and statistics, mathematics and computer science, linguistics, sociology, and marketing. Venn Diagrams are also often used to visually summarize the status and future viability of a project.
HelpDesk
How to Create a Data Flow Diagram using ConceptDraw PRO
 example")
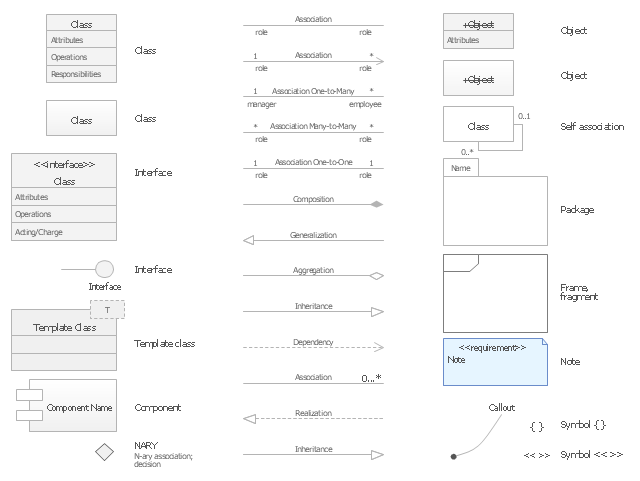
The vector stencils library "UML class diagrams" contains 38 symbols for the ConceptDraw PRO diagramming and vector drawing software.
"... classes are represented with boxes which contain three parts:
(1) The top part contains the name of the class. It is printed in Bold, centered and the first letter capitalized.
(2) The middle part contains the attributes of the class. They are left aligned and the first letter is lower case.
(3) The bottom part gives the methods or operations the class can take or undertake. They are also left aligned and the first letter is lower case. ...
To indicate a classifier scope for a member, its name must be underlined. ...
An association can be named, and the ends of an association can be adorned with role names, ownership indicators, multiplicity, visibility, and other properties. ...
Aggregation ... is graphically represented as a hollow diamond shape on the containing class end of the tree with a single line that connects the contained class to the containing class.
... graphical representation of a composition relationship is a filled diamond shape on the containing class end of the tree of lines that connect contained class(es) to the containing class.
... graphical representation of a Generalization is a hollow triangle shape on the superclass end of the line (or tree of lines) that connects it to one or more subtypes.
... graphical representation of a Realization is a hollow triangle shape on the interface end of the dashed line (or tree of lines) that connects it to one or more implementers. A plain arrow head is used on the interface end of the dashed line that connects it to its users.
Multiplicity ... representation of an association is a line with an optional arrowhead indicating the role of the object(s) in the relationship, and an optional notation at each end indicating the multiplicity of instances of that entity (the number of objects that participate in the association).
Entity classes ... are drawn as circles with a short line attached to the bottom of the circle. Alternatively, they can be drawn as normal classes with the «entity» stereotype notation above the class name." [Class diagram. Wikipedia]
The example "Design elements - UML class diagrams" is included in the Rapid UML solution from the Software Development area of ConceptDraw Solution Park.
UML class diagram symbols
 Fishbone Diagram
Fishbone Diagrams solution extends ConceptDraw PRO software with templates, samples and library of vector stencils for drawing the Ishikawa diagrams for cause and effect analysis.
 Accounting Flowcharts
Accounting Flowcharts solution extends ConceptDraw PRO software with templates, samples and library of vector stencils for drawing the accounting flow charts.
 SWOT Analysis
SWOT and TOWS Matrix Diagrams solution extends ConceptDraw PRO and ConceptDraw MINDMAP software with features, templates, samples and libraries of vector stencils for drawing SWOT and TOWS analysis matrices and mind maps.
- Components of ER Diagram | Entity Relationship Diagram Symbols ...
- Entity Relationship Diagram Symbols and Meaning ERD Symbols ...
- Design elements - ERD (crow's foot notation) | Entity Relationship ...
- Entity Relationship Diagram Symbols and Meaning ERD Symbols ...
- Components of ER Diagram | Data Flow Diagrams with ...
- Components of ER Diagram | Design elements - ER diagram (Chen ...
- ERD Symbols and Meanings | Design elements - ER diagram (Chen ...
- Entity Relationship Diagram Examples
- Entity Relationship Diagram Software for Design Crows Foot ER ...
- Entity - Relationship Diagram (ERD) | Components of ER Diagram ...
- Components of ER Diagram | Entity Relationship Diagrams | Entity ...
- Components of ER Diagram | Entity - Relationship Diagram (ERD ...
- Entity Relationship Diagram Examples | Entity - Relationship Diagram ...
- Data Flow Diagrams | Entity - Relationship Diagram (ERD) with ...
- Entity - Relationship Diagram (ERD)
- Entity Relationship Diagram Symbols and Meaning ERD Symbols ...
- Design elements - ER diagram (Chen notation) | Entity Relationship ...
- Components of ER Diagram | Process Flowchart | Entity ...
- Design elements - ER diagram (Chen notation) | Design elements ...
- Entity Relationship Diagram Symbols and Meaning ERD Symbols ...
- ERD | Entity Relationship Diagrams, ERD Software for Mac and Win
- Flowchart | Basic Flowchart Symbols and Meaning
- Flowchart | Flowchart Design - Symbols, Shapes, Stencils and Icons
- Flowchart | Flow Chart Symbols
- Electrical | Electrical Drawing - Wiring and Circuits Schematics
- Flowchart | Common Flowchart Symbols
- Flowchart | Common Flowchart Symbols