Process Flowchart
ConceptDraw is Professional business process mapping software for making process flow diagram, workflow diagram, general flowcharts and technical illustrations for business documents. It is includes rich examples, templates, process flowchart symbols. ConceptDraw flowchart maker allows you to easier create a process flowchart. Use a variety of drawing tools, smart connectors, flowchart symbols and shape libraries to create flowcharts of complex processes, process flow diagrams, procedures and information exchange.
Technical Drawing Software
Technical Drawing Software for drawing technical diagram, electrical and technical drawing. Download Drawing Software ConcepDraw for Free.ConceptDraw PRO extended with: Mechanical Engineering Solution, Electrical Engineering Solution, Chemical and Process Engineering Solution from the Industrial Engineering Area is powerful software for business and technical drawing. Its powerful drawing tools, predesigned vector objects, templates, samples are helpful for creation all kinds of Technical Drawings and Technical Diagrams, Electrical and Mechanical Schematics, Circuit and Wiring Diagrams, Structural Drawings, and many other.
HelpDesk
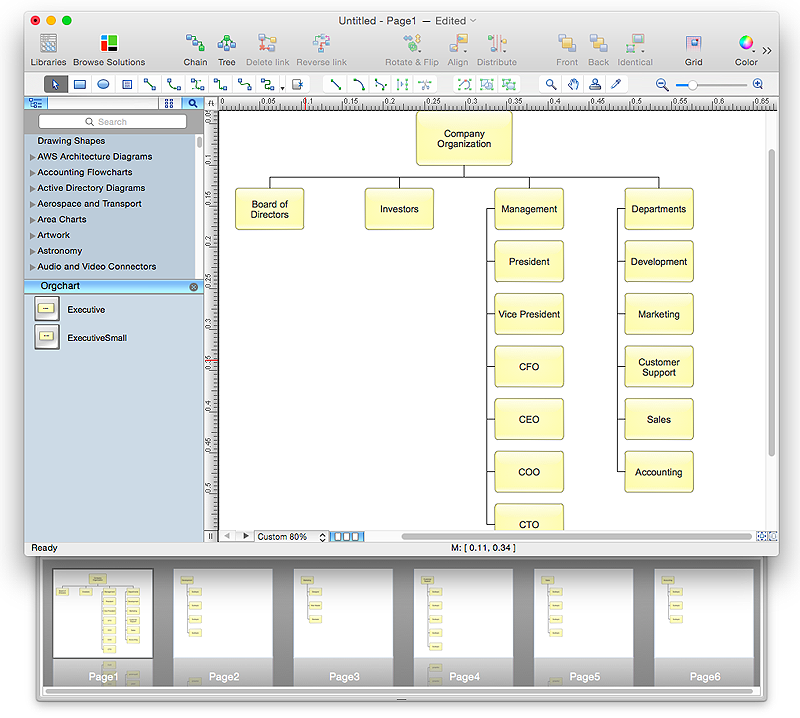
How to Create Organizational Chart Quickly
Use ConceptDraw MINDMAP for generating structured data on organization structure and then ConceptDraw PRO for presenting the results as chart.HelpDesk
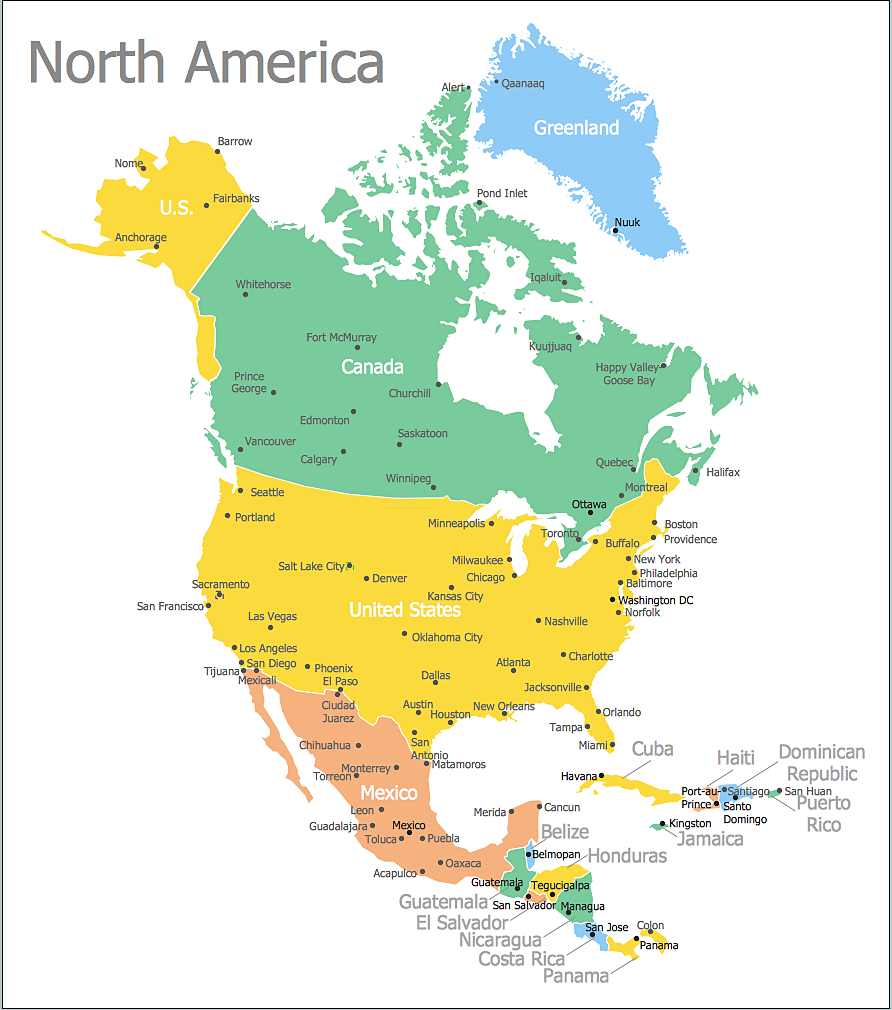
How to Draw a Map of North America Using ConceptDraw PRO
Geographic maps, cardiograms, and thematic maps are often used for geographical visualization of business information. Any country can inspire a wealth of geopolitical statistical data. A common way of assimilating this data is to create maps that convey a particular theme or subject matter in relation to a specific geographical area. Known as thematic maps, they cover themes such as population density, average rainfall, or political allegiance, differentiating the data by using graphical elements and annotation. Thematic maps contrast general reference maps, which tend to display information on a variety of subjects — vegetation, topology, roads and highways, for example. A thematic map will always focus on one particular subject matter. ConceptDraw PRO can be helpful as a tool for creating maps of countries and regions of the world. It allows you to draw continental maps quickly and easily using the special templates and vector stencils libraries.HelpDesk
How to Create a Bar Chart in ConceptDraw PRO
Bar charts (bar graphs) are diagrams displaying data as horizontal or vertical bars of certain heights.Bar charts are widely used to show and compare the values of the same parameters for different data groups.
The bar graph can be vertical or horizontal. This depends on the amount of categories. There are many methods in which bar graph can be built and this makes it a very often used chart type. Usually, a bar chart is created so that the bars are placed vertically. Such arrangement means that the bar's height value is proportional to the category value. Nevertheless, a bar chart can be also drawn horizontally. This means that the longer the bar, the bigger the category. Thus, a bar chart is a good way to present the relative values of different measured items. The ConceptDraw Bar Graphs solution allows you to draw a bar chart quickly using a vector library, containing the set of various bar charts objects.
HelpDesk
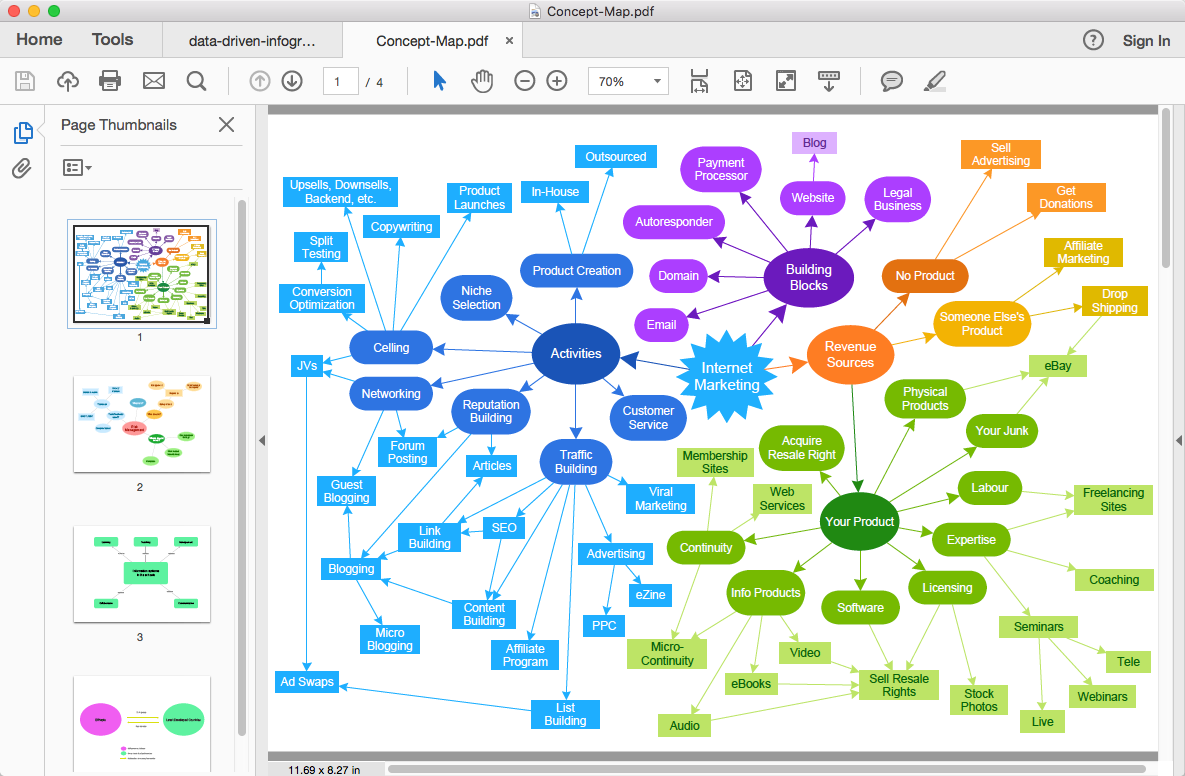
How To Convert a Concept Map to Adobe PDF
ConceptDraw PRO allows you to easy share your concept maps between different computers with different operating systems and applications using it's export capabilities.You can get clear business graphic pack in pdf format and easily communicate it with stakeholders.Export from ConceptDraw PRO Document to a Graphic File
Now it’s easy to share your visual documents with other people in a form most convenient for them.ConceptDraw PRO can save your drawings and diagrams in a number of highly useful formats, including graphic files. You can save your drawing as a .PNG, .JPG, or other graphic format file.

HelpDesk
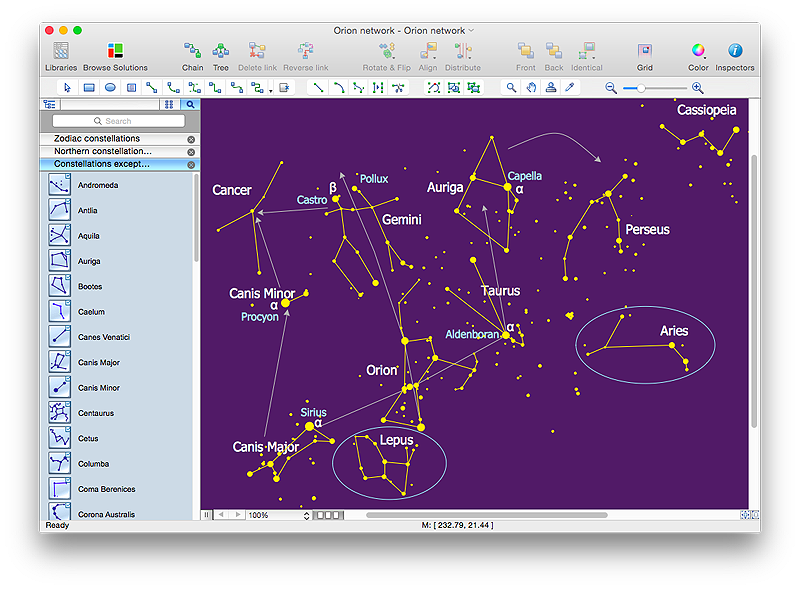
How to Draw a Сonstellation Сhart
Astronomic maps are used to locate stars, planets and other objects in the sky for a certain date, time and observing location. ConceptDraw Astronomy solution can be used as a tool for creating astronomy maps, charts and illustrations that contains astronomy symbols of constellations, galaxies, stars and planets. It allows you to draw the map of any constellation quickly and easily using the special templates and vector stencils libraries.HelpDesk
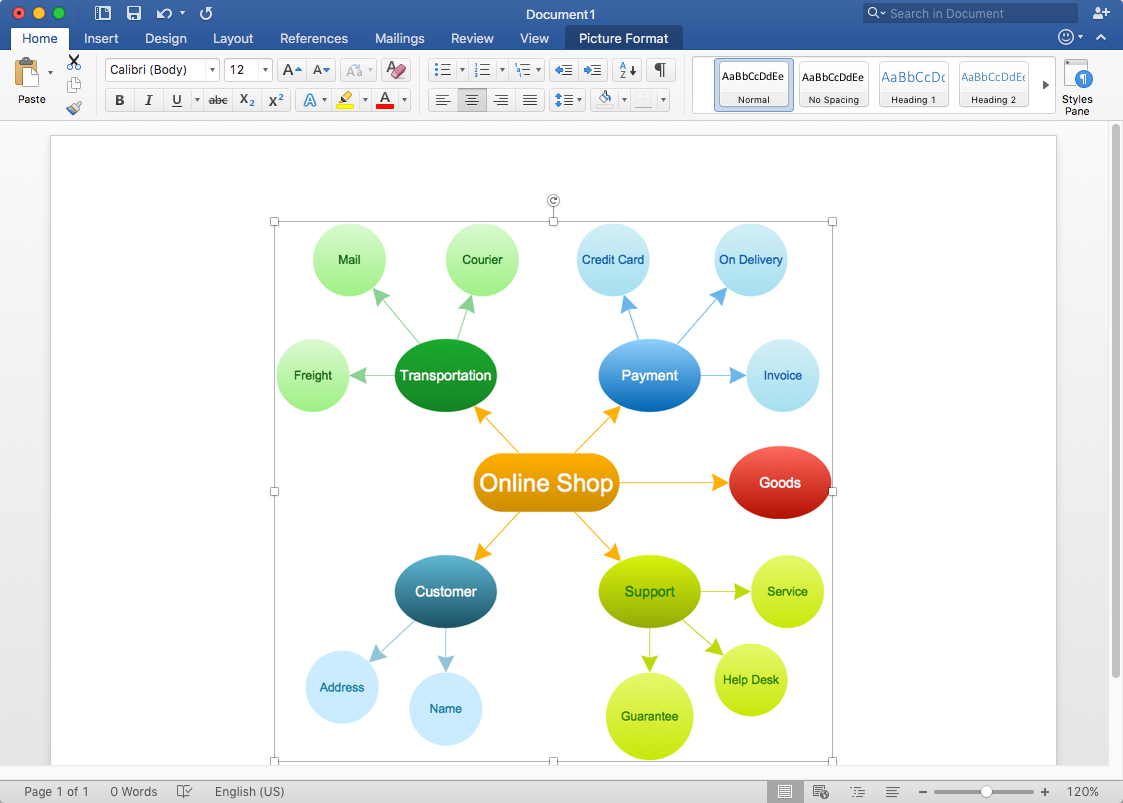
How to Add a Concept Map to MS Word Document
ConceptDraw PRO allows you to easily create concept maps and then insert them into a MS Word document.HelpDesk
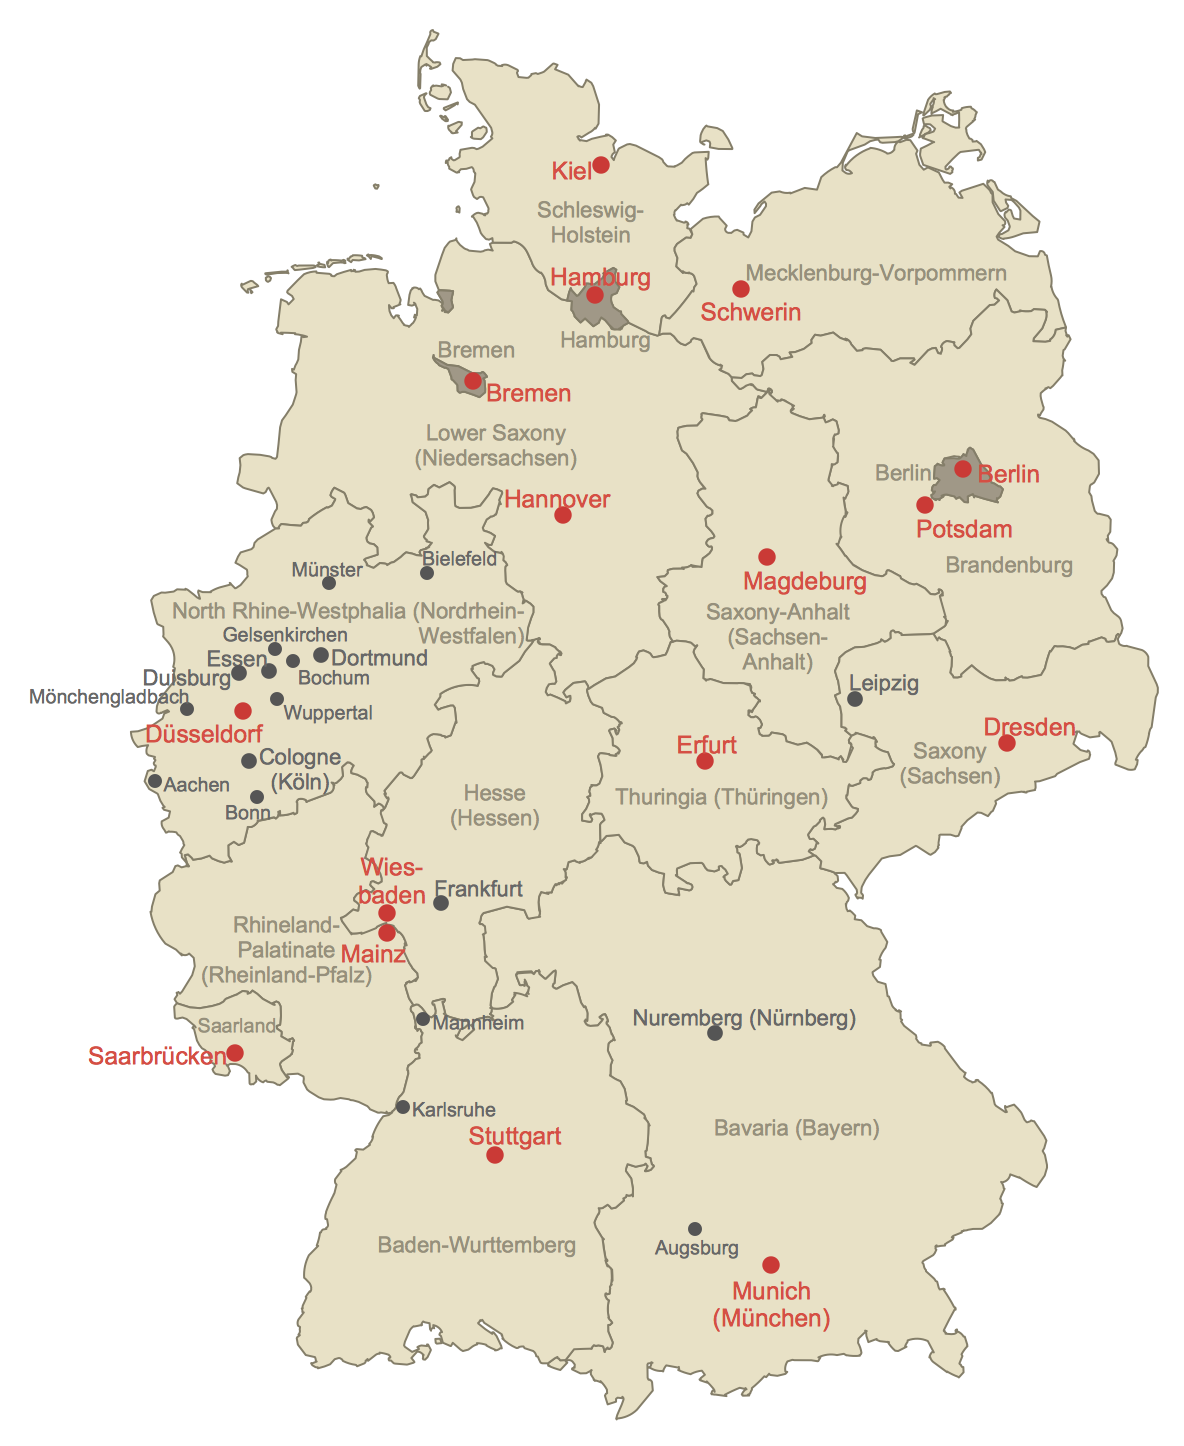
How to Create a Map of Germany Using ConceptDraw PRO
Geographical thematic maps are used to display information on a variety of subjects. It is a common way of representing any form of spatial data in relation to a specific geographical area. The Germany Map Solution for ConceptDraw PRO includes all of the German federal states with county outlined borders and major cities. You can quickly create geographic maps, cartograms, and thematic maps for geographical visualization information for business and travels.HelpDesk
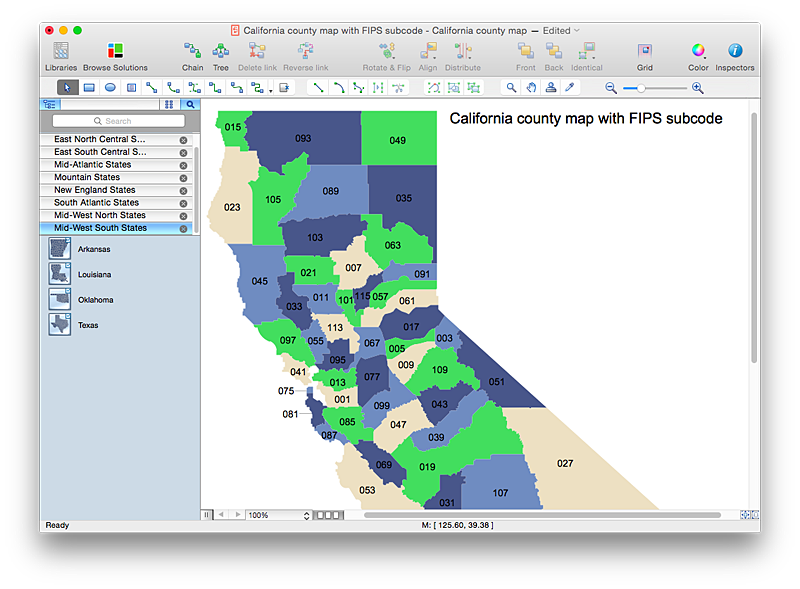
How to Draw a Map of USA States Using ConceptDraw PRO
You can found a huge set of geopolitical statistical data regarding America. A common way of visualizing this data is to create maps that connect a particular data in relation to a specific geographical area. Thematic maps are used to depict such data as population density, average rainfall, or political allegiance, representing the data by using visual elements and annotation. Thematic maps always focus on one particular subject matter unlike general reference maps, which display information on a different subjects — vegetation, topology, roads and highways, etc.The United States Mapping Solution for ConceptDraw PRO includes all of the US States with county outlined borders, from the largest, San Bernardino in California, to the smallest Kalawao County, Hawaii.
HelpDesk
How to Draw Chemistry Structures
Making chemistry drawings for science and education purposes involves many different elements that can be managed using ConceptDraw PRO. ConceptDraw Chemistry solution can be used as a tool for creating chemical schemes and diagrams of chemical lab set-ups and labware, formulas, reaction schemes, and molecular structures. With ConceptDraw PRO you can easily create and communicate chemistry drawings of any complexity.Flow chart Example. Warehouse Flowchart
Warehouse Flowcharts are different diagrams describing wharehousing and inventory menagement processes. Typical purposes of warehouse flowcharts are evaluating warehouse performance and organizational performance, measuring efficiency of customer service. This type of workflow diagrams can be used for identifying any disconnection between business activities and business objectives.Standard warehousing process flow diagram and standard workflow diagram used for process identification for further evaluating effectiveness and profitability of overall business process. Use the ConceptDraw PRO diagramming and vector drawing software extended with the Flowcharts solution from the Diagrams area of ConceptDraw Solution Park to design your own workflow diagrams, process flow diagram and flow charts. Need to use Process Flow Diagram for designing Warehouse packages flow.

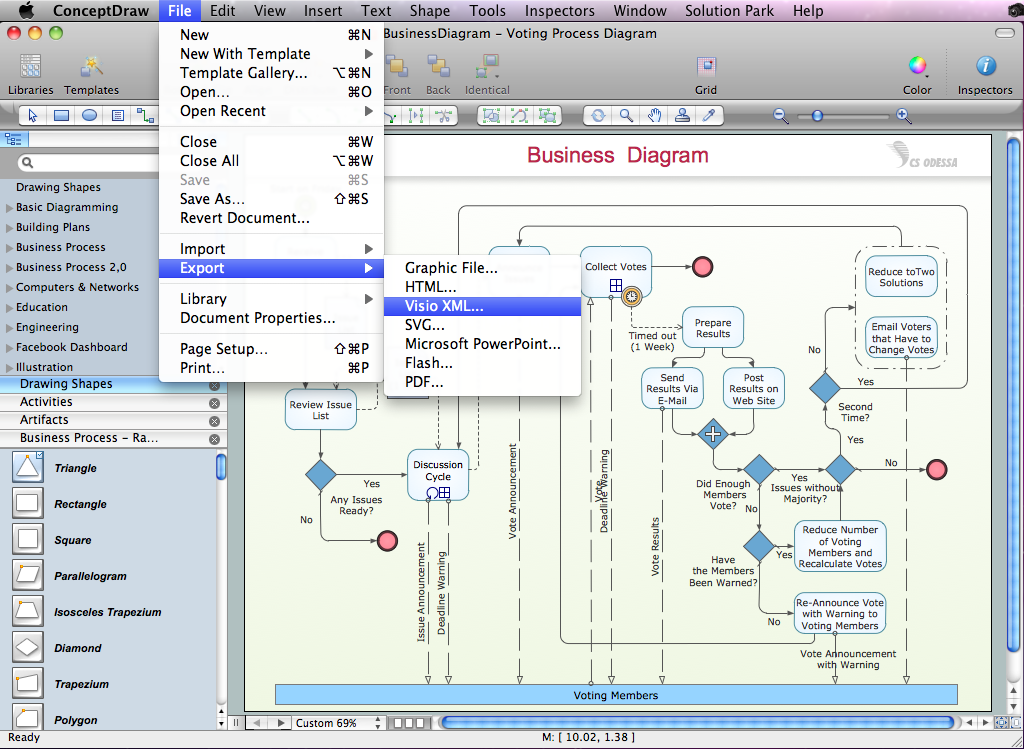
Export from ConceptDraw PRO Document to MS Visio® XML
Once you have created your document in ConceptDraw PRO and you want to share it with your colleagues and friends, who uses MS Visio on their computers, you can easily export your document using ConceptDraw PRO export to Visio XML files (VDX) feature.Now you can share your ConceptDraw documents with MS Visio users.

HelpDesk
How to Draw a Line Chart Quickly
A common line chart is a graphical representation of the functional relationship between two series of data. A line chart that is created by connecting a series of data points together with a straight line is the most basic type of a line chart. A line chart can be used for depicting data that changes continuously over time. It is extensively utilized in statistics, marketing and financial business. ConceptDraw Line Graph solution provides the possibility to make 2D line charts quickly and effortlessly.- Directional Maps | Mechanical Engineering 2d Drawing Symbols Chart
- Engineering Drawing Chart Map
- Engineering Drawing Charts
- Business Board Org Chart | Directional Maps | Maps and Directions ...
- Importance Of Engineering Drawing In Chemical Engineering
- Different Engineering Drawing Figure Chart
- Chemical Engineering Process Flow Diagram Software Free
- Quality Mind Map | Process Flowchart | Mechanical Engineering ...
- Mechanical Engineering | Process Flowchart | Electrical Drawing ...
- Engineering Process Flow Value Map
- Constellation Chart | Astronomy | Sun Solar System | The Expanse ...
- Types of Welding in Flowchart | Process Flow Chart | Mechanical ...
- Mechanical Engineering | Pie Charts | Basic Pie Charts | Mechanical ...
- Flow Map | Food Court | Technical Flow Chart | Drawing Of Food Flow
- Process Flowchart | Technical Drawing Software | Mechanical
- Chart Of Joining Engineering Materials
- Process Flowchart | Cnc Machining In Engineering Drawing Explain ...
- Mechanical Engineering | Engineering | How to Create a ...
- Engineering Drawing Importance In Chemical Engineering
- Mechanical Engineering | Mind Map Exchange | How to Draw an ...
- ERD | Entity Relationship Diagrams, ERD Software for Mac and Win
- Flowchart | Basic Flowchart Symbols and Meaning
- Flowchart | Flowchart Design - Symbols, Shapes, Stencils and Icons
- Flowchart | Flow Chart Symbols
- Electrical | Electrical Drawing - Wiring and Circuits Schematics
- Flowchart | Common Flowchart Symbols
- Flowchart | Common Flowchart Symbols


