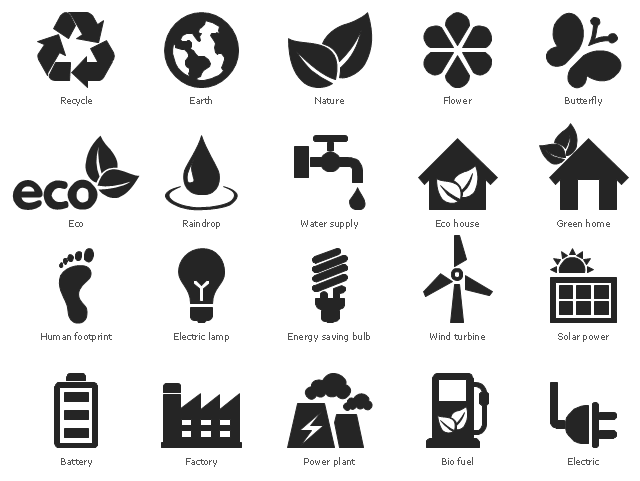
The vector stencils library "Ecology pictograms" contains 20 icons of eco symbols. Use it to draw your ecological infographics. The example "Ecology pictograms - Vector stencils library" was created using the ConceptDraw PRO diagramming and vector drawing software extended with the Pictorial infographics solution from the area "What is infographics" in ConceptDraw Solution Park.
Recycle
Nature

Flower

Butterfly

Earth

Raindrop

Water supply
Eco house

Green home

Electric

Electric lamp

Energy saving bulb

Factory

Power plant
Battery

Bio fuel
Wind turbine
Solar power

Eco
Human footprint

 Sales Flowcharts
The Sales Flowcharts solution lets you create and display sales process maps, sales process workflows, sales steps, the sales process, and anything else involving sales process management.
 Pie Charts
Pie Charts are extensively used in statistics and business for explaining data and work results, in mass media for comparison (i.e. to visualize the percentage for the parts of one total), and in many other fields. The Pie Charts solution for ConceptDraw PRO v10 offers powerful drawing tools, varied templates, samples, and a library of vector stencils for simple construction and design of Pie Charts, Donut Chart, and Pie Graph Worksheets.
The vector stencils library "Ecology pictograms" contains 20 icons of eco symbols. Use it to draw your ecological infographics. The example "Ecology pictograms - Vector stencils library" was created using the ConceptDraw PRO diagramming and vector drawing software extended with the Pictorial infographics solution from the area "What is infographics" in ConceptDraw Solution Park.
Recycle
Nature
Flower
Butterfly
Earth
Raindrop
Water supply
Eco house
Green home
Electric
Electric lamp
Energy saving bulb
Factory
Power plant
Battery
Bio fuel
Wind turbine
Solar power
Eco
Human footprint
Design Pictorial Infographics. Design Infographics

The vector stencils library "Ecology pictograms" contains 20 ecological pictograms.
Use it to draw your eco illustrations, presentations, web pages and infographics.
The example "Design elements - Ecology pictograms" was created using the ConceptDraw PRO diagramming and vector drawing software extended with the Pictorial Infographic solution from the area "What is infographics" in ConceptDraw Solution Park.
Eco pictograms
 Manufacturing and Maintenance
Manufacturing and maintenance solution extends ConceptDraw PRO software with illustration samples, templates and vector stencils libraries with clip art of packaging systems, industrial vehicles, tools, resources and energy.
Educational Technology Tools

Infographic Maker

 Divided Bar Diagrams
The Divided Bar Diagrams Solution extends the capabilities of ConceptDraw PRO v10 with templates, samples, and a library of vector stencils for drawing high impact and professional Divided Bar Diagrams and Graphs, Bar Diagram Math, and Stacked Graph.
 Picture Graphs
Typically, a Picture Graph has very broad usage. They many times used successfully in marketing, management, and manufacturing. The Picture Graphs Solution extends the capabilities of ConceptDraw PRO v10 with templates, samples, and a library of professionally developed vector stencils for designing Picture Graphs.
 Health Food
The Health Food solution contains the set of professionally designed samples and large collection of vector graphic libraries of healthy foods symbols of fruits, vegetables, herbs, nuts, beans, seafood, meat, dairy foods, drinks, which give powerful possi
 Target and Circular Diagrams
This solution extends ConceptDraw PRO software with samples, templates and library of design elements for drawing the Target and Circular Diagrams.
- Renewable energy | Design elements - Ecology pictograms | Design ...
- Renewable energy | Design elements - Ecology pictograms ...
- Renewable energy | Turbine Windmill Png
- Design elements - Ecology pictograms | Design Pictorial ...
- Renewable energy | Ecology pictograms - Vector stencils library ...
- Ecology pictograms - Vector stencils library | Design elements ...
- Windmills Png
- Human Pictogram Png
- Solar Batteries Icon Png
- Ecology Png
- Ecology pictograms - Vector stencils library | Design elements ...
- Ecology pictograms - Vector stencils library | Design elements ...
- Site Plans | Site plan | Ecology pictograms - Vector stencils library ...
- Ecology pictograms - Vector stencils library | Process Flow Chart ...
- Plant Layout Plans | Ecology pictograms - Vector stencils library ...
- Resources and energy - Vector stencils library | Energy resources ...
- Design elements - Resources and energy | Resources and energy ...
- Ecology pictograms - Vector stencils library | Ecology pictograms ...
- Gas Power Plant Icon Png
- Design elements - Ecology pictograms
- ERD | Entity Relationship Diagrams, ERD Software for Mac and Win
- Flowchart | Basic Flowchart Symbols and Meaning
- Flowchart | Flowchart Design - Symbols, Shapes, Stencils and Icons
- Flowchart | Flow Chart Symbols
- Electrical | Electrical Drawing - Wiring and Circuits Schematics
- Flowchart | Common Flowchart Symbols
- Flowchart | Common Flowchart Symbols