"The United States is the 800th largest energy consumer in terms of total use in 2010. ...
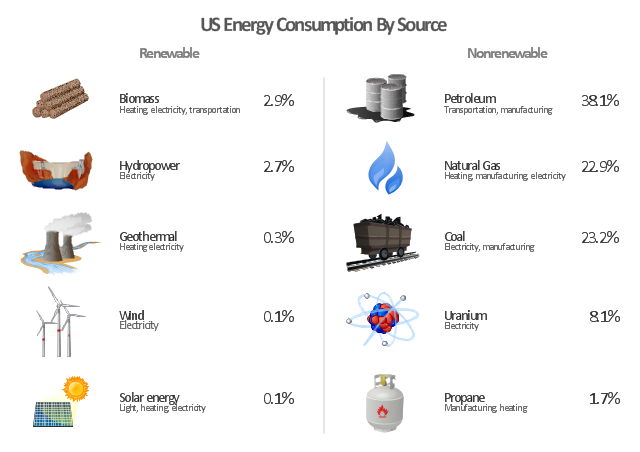
The majority of this energy is derived from fossil fuels: in 2010, data showed 25% of the nation's energy came from petroleum, 22% from coal, and 22% from natural gas. Nuclear power supplied 8.4% and renewable energy supplied 8%, which was mainly from hydroelectric dams although other renewables are included such as wind power, geothermal and solar energy." [Energy in the United States. Wikipedia]
The infographics example "U.S. energy consumption by source" was created in the ConceptDraw PRO diagramming and vector drawing software using the Manufacturing and Maintenance solution from the Illustration area of ConceptDraw Solution Park.
Infographics
 Target and Circular Diagrams
This solution extends ConceptDraw PRO software with samples, templates and library of design elements for drawing the Target and Circular Diagrams.
 Manufacturing and Maintenance
Manufacturing and maintenance solution extends ConceptDraw PRO software with illustration samples, templates and vector stencils libraries with clip art of packaging systems, industrial vehicles, tools, resources and energy.
 Divided Bar Diagrams
The Divided Bar Diagrams Solution extends the capabilities of ConceptDraw PRO v10 with templates, samples, and a library of vector stencils for drawing high impact and professional Divided Bar Diagrams and Graphs, Bar Diagram Math, and Stacked Graph.
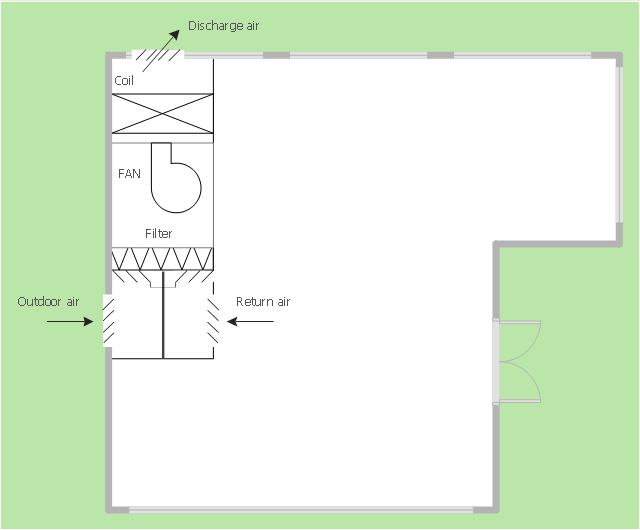
This mechanical room HVAC plan sample shows the layout of air handler (air handling unit, AHU) equipment: mixing chamber, air filter, fan (blower), heat exchanger coil, diffusers.
"Ventilating (the V in HVAC) is the process of "changing" or replacing air in any space to provide high indoor air quality (i.e. to control temperature, replenish oxygen, or remove moisture, odors, smoke, heat, dust, airborne bacteria, and carbon dioxide). Ventilation is used to remove unpleasant smells and excessive moisture, introduce outside air, to keep interior building air circulating, and to prevent stagnation of the interior air.
Ventilation includes both the exchange of air to the outside as well as circulation of air within the building. It is one of the most important factors for maintaining acceptable indoor air quality in buildings. Methods for ventilating a building may be divided into mechanical/ forced and natural types.
"Mechanical" or "forced" ventilation is used to control indoor air quality. Excess humidity, odors, and contaminants can often be controlled via dilution or replacement with outside air. However, in humid climates much energy is required to remove excess moisture from ventilation air.
Ventilation increases the energy needed for heating or cooling, however heat recovery ventilation can be used to mitigate the energy consumption. This involves heat exchange between incoming and outgoing air. Energy recovery ventilation additionally includes exchange of humidity." [Ventilation (architecture). Wikipedia]
The HVAC floor plan example "Ventilation system layout" was created using the ConceptDraw PRO diagramming and vector drawing software extended with the HVAC Plans solution from the Building Plans area of ConceptDraw Solution Park.
HVAC floor plan
"Consumption of energy resources, (e.g. turning on a light) requires resources and has an effect on the environment. Many electric power plants burn coal, oil or natural gas in order to generate electricity for energy needs. While burning these fossil fuels produces a readily available and instantaneous supply of electricity, it also generates air pollutants including carbon dioxide (CO2), sulfur dioxide and trioxide (SOx) and nitrogen oxides (NOx). Carbon dioxide is an important greenhouse gas which is thought to be responsible for some fraction of the rapid increase in global warming seen especially in the temperature records in the 20th century, as compared with tens of thousands of years worth of temperature records which can be read from ice cores taken in Arctic regions. Burning fossil fuels for electricity generation also releases trace metals such as beryllium, cadmium, chromium, copper, manganese, mercury, nickel, and silver into the environment, which also act as pollutants.
The large-scale use of renewable energy technologies would "greatly mitigate or eliminate a wide range of environmental and human health impacts of energy use". Renewable energy technologies include biofuels, solar heating and cooling, hydroelectric power, solar power, and wind power. Energy conservation and the efficient use of energy would also help." [Energy industry. Environmental impact. Wikipedia]
The Energy resources diagram example was created in the ConceptDraw PRO diagramming and vector drawing software using the Manufacturing and Maintenance solution from the Illustration area of ConceptDraw Solution Park.
Infographics

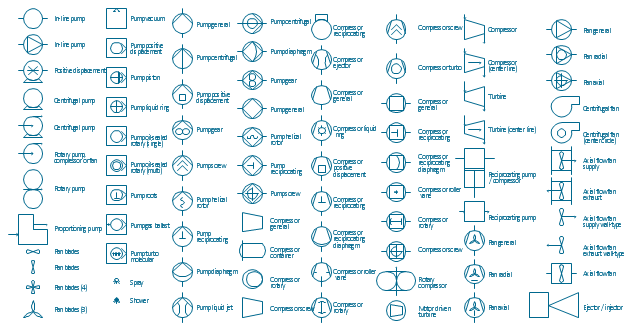
The vector stencils library "Pumps" contains 82 symbols of pumps, compressors, fans, turbines, and power generators.
Use these icons to design pumping systems, air and fluid compression systems, and industrial process diagrams.
"A pump is a device that moves fluids (liquids or gases), or sometimes slurries, by mechanical action. Pumps can be classified into three major groups according to the method they use to move the fluid: direct lift, displacement, and gravity pumps.
Pumps operate by some mechanism (typically reciprocating or rotary), and consume energy to perform mechanical work by moving the fluid. Pumps operate via many energy sources, including manual operation, electricity, engines, or wind power, come in many sizes, from microscopic for use in medical applications to large industrial pumps.
Mechanical pumps serve in a wide range of applications such as pumping water from wells, aquarium filtering, pond filtering and aeration, in the car industry for water-cooling and fuel injection, in the energy industry for pumping oil and natural gas or for operating cooling towers. In the medical industry, pumps are used for biochemical processes in developing and manufacturing medicine, and as artificial replacements for body parts, in particular the artificial heart and penile prosthesis.
In biology, many different types of chemical and bio-mechanical pumps have evolved, and biomimicry is sometimes used in developing new types of mechanical pumps." [Pump. Wikipedia]
The example "Design elements - Pumps" was created using the ConceptDraw PRO diagramming and vector drawing software extended with the Chemical and Process Engineering solution from the Engineering area of ConceptDraw Solution Park.
Pump symbols
The vector stencils library "Citric acid cycle (TCA cycle)" contains 26 symbols of metabolites for drawing metabolic pathway maps and biochemical shematic diagrams of the citric acid cycle (TCA cycle, tricarboxylic acid cycle, Krebs cycle) and diagrams of metabolism processes.
"The citric acid cycle - also known as the tricarboxylic acid cycle (TCA cycle), or the Krebs cycle, - is a series of chemical reactions used by all aerobic organisms to generate energy through the oxidation of acetate derived from carbohydrates, fats and proteins into carbon dioxide and chemical energy in the form of adenosine triphosphate (ATP). In addition, the cycle provides precursors of certain amino acids as well as the reducing agent NADH that is used in numerous other biochemical reactions. Its central importance to many biochemical pathways suggests that it was one of the earliest established components of cellular metabolism and may have originated abiogenically.
The name of this metabolic pathway is derived from citric acid (a type of tricarboxylic acid) that is consumed and then regenerated by this sequence of reactions to complete the cycle. In addition, the cycle consumes acetate (in the form of acetyl-CoA) and water, reduces NAD+ to NADH, and produces carbon dioxide as a waste byproduct. The NADH generated by the TCA cycle is fed into the oxidative phosphorylation (electron transport) pathway. The net result of these two closely linked pathways is the oxidation of nutrients to produce usable chemical energy in the form of ATP." [Citric acid cycle. Wikipedia]
The shapes example "Design elements - TCA cycle" is included in the Biology solution from the Science and Education area of ConceptDraw Solution Park.
Tricarboxylic acid cycle (Krebs cycle) symbols
-symbols--design-elements---tca-cycle.png--diagram-flowchart-example.png)
 Pie Charts
Pie Charts are extensively used in statistics and business for explaining data and work results, in mass media for comparison (i.e. to visualize the percentage for the parts of one total), and in many other fields. The Pie Charts solution for ConceptDraw PRO v10 offers powerful drawing tools, varied templates, samples, and a library of vector stencils for simple construction and design of Pie Charts, Donut Chart, and Pie Graph Worksheets.
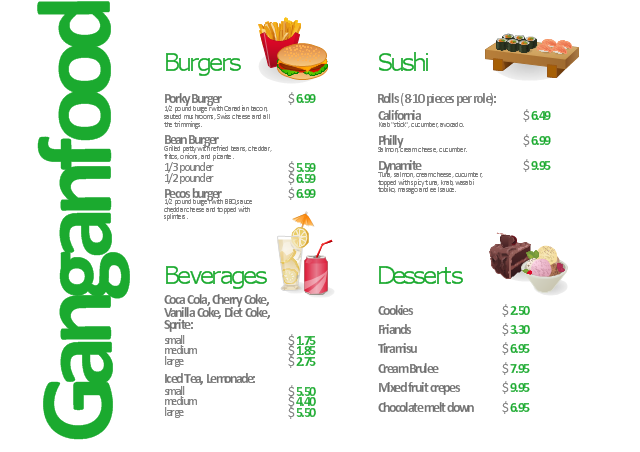
Use the vector clipart library Food to draw illustrations on meal and drink, food and beverage, diet, cuisine, cooking, healty nutrition, fast food.
"Food is any substance consumed to provide nutritional support for the body. It is usually of plant or animal origin, and contains essential nutrients, such as carbohydrates, fats, proteins, vitamins, or minerals. The substance is ingested by an organism and assimilated by the organism's cells in an effort to produce energy, maintain life, or stimulate growth." [Food. Wikipedia]
The vector graphics example Fast food restaurant menu prices was created using ConceptDraw PRO diagramming and vector drawing software extended with Artwork solution from Illustration area of ConceptDraw Solution Park.
Infographics
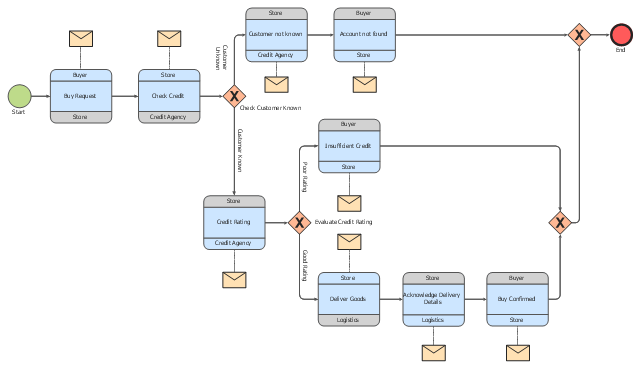
"Logistics is the management of the flow of goods between the point of origin and the point of consumption in order to meet some requirements, for example, of customers or corporations. The resources managed in logistics can include physical items, such as food, materials, animals, equipment and liquids, as well as abstract items, such as time, information, particles, and energy. The logistics of physical items usually involves the integration of information flow, material handling, production, packaging, inventory, transportation, warehousing, and often security. The complexity of logistics can be modeled, analyzed, visualized, and optimized by dedicated simulation software. The minimization of the use of resources is a common motivation in logistics for import and export." [Logistics. Wikipedia]
The BPMN 2.0 (Business Process Model and Notation) diagram example "Logistics" was created using the ConceptDraw PRO diagramming and vector drawing software extended with the Business Process Diagram solution from the Business Processes area of ConceptDraw Solution Park.
The BPMN 2.0 (Business Process Model and Notation) diagram example "Logistics" was created using the ConceptDraw PRO diagramming and vector drawing software extended with the Business Process Diagram solution from the Business Processes area of ConceptDraw Solution Park.
Choreography diagram BPMN 2.0
- Resources and energy - Vector stencils library | Energy resources ...
- Design elements - Power sources | U.S. energy consumption by ...
- Drawing On Energy Sources
- Energy Pyramid Diagram | How to Create a Scatter Chart | U.S. ...
- Energy resources diagram | Vector Map of Germany | U.S. energy ...
- Domestic sector SWOT | Pie chart - Domestic energy consumption ...
- Resources and energy - Vector stencils library | Energy Pyramid ...
- Resources and energy - Vector stencils library | Energy resources ...
- Drawings Of Energy Resources
- All The Energy Resources In Histogram Pie Chart And Bar Graph
- Process Diagrams | Resources and energy - Vector stencils library ...
- Project On Energy And Resource With Showing Pie Char Bar Graph
- Design elements - Power sources | Power sources - Vector stencils ...
- Drawings Of Energy Foods
- Energy Pyramid Diagram | Scatter Chart Examples | Chart Examples ...
- Energy Resources Drawing
- Chart Examples | Pyramid Diagram | Pie Charts | Energy And Its ...
- Pyramid Diagram | How to Create a Scatter Chart | Chart Examples ...
- Resources and energy - Vector stencils library | Manufacturing and ...
- Energy Pyramid Diagram | Diagram of a Pyramid | Pyramid Charts ...
- ERD | Entity Relationship Diagrams, ERD Software for Mac and Win
- Flowchart | Basic Flowchart Symbols and Meaning
- Flowchart | Flowchart Design - Symbols, Shapes, Stencils and Icons
- Flowchart | Flow Chart Symbols
- Electrical | Electrical Drawing - Wiring and Circuits Schematics
- Flowchart | Common Flowchart Symbols
- Flowchart | Common Flowchart Symbols