Chart Examples

 Tilt and Turn Windows
Tilt and Turn Windows solution provides professional tools and ready-to-use vector design objects making the process of window design simple and comfortable, allowing easily model the windows constructions, to draw the sketches and schematics of windows, to create detailed drawings of window designs combining different types of sashes, designing the tilt inward and outward windows, single, double window or multi-panel windows, single hung window, double hung window, and many other window types with depiction of sizes and types of turn constructions.
Chart Templates

 Workflow Diagrams
Workflow Diagrams solution extends ConceptDraw DIAGRAM software with samples, templates and vector stencils library for drawing the work process flowcharts.
"Consumption of energy resources, (e.g. turning on a light) requires resources and has an effect on the environment. Many electric power plants burn coal, oil or natural gas in order to generate electricity for energy needs. While burning these fossil fuels produces a readily available and instantaneous supply of electricity, it also generates air pollutants including carbon dioxide (CO2), sulfur dioxide and trioxide (SOx) and nitrogen oxides (NOx). Carbon dioxide is an important greenhouse gas which is thought to be responsible for some fraction of the rapid increase in global warming seen especially in the temperature records in the 20th century, as compared with tens of thousands of years worth of temperature records which can be read from ice cores taken in Arctic regions. Burning fossil fuels for electricity generation also releases trace metals such as beryllium, cadmium, chromium, copper, manganese, mercury, nickel, and silver into the environment, which also act as pollutants.
The large-scale use of renewable energy technologies would "greatly mitigate or eliminate a wide range of environmental and human health impacts of energy use". Renewable energy technologies include biofuels, solar heating and cooling, hydroelectric power, solar power, and wind power. Energy conservation and the efficient use of energy would also help." [Energy industry. Environmental impact. Wikipedia]
The Energy resources diagram example was created in the ConceptDraw PRO diagramming and vector drawing software using the Manufacturing and Maintenance solution from the Illustration area of ConceptDraw Solution Park.
Infographics

Design Pictorial Infographics. Design Infographics

 SWOT and TOWS Matrix Diagrams
SWOT and TOWS Matrix Diagrams solution extends ConceptDraw DIAGRAM and ConceptDraw MINDMAP software with features, templates, samples and libraries of vector stencils for drawing SWOT and TOWS analysis matrices and mind maps.
SWOT Template

Infographic Maker

Windows Azure
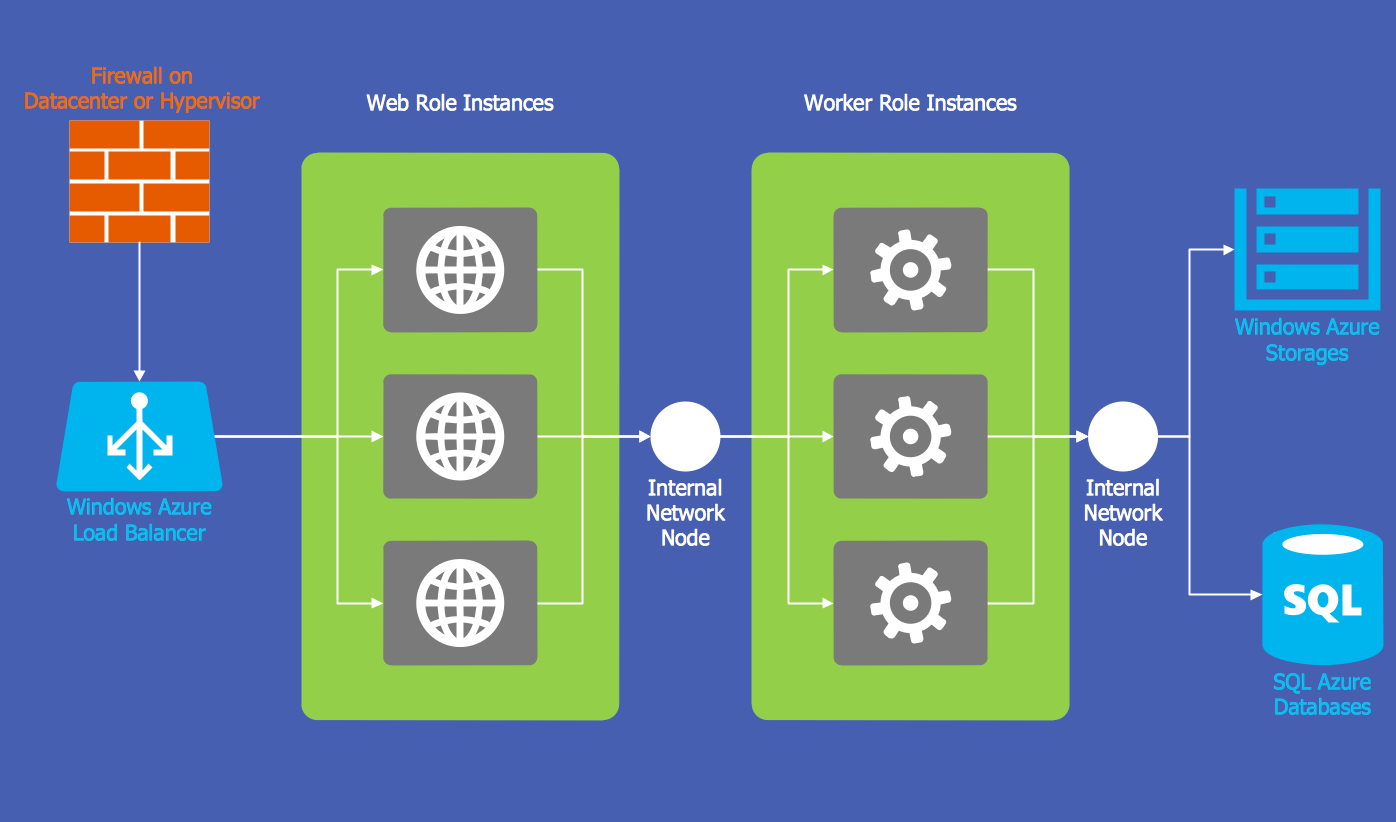
ConceptDraw DIAGRAM diagramming and vector drawing software provides the Azure Architecture Solution from the Computer and Networks area of ConceptDraw Solution Park with a lot of useful tools which make easier: illustration of Windows Azure possibilities and features, describing Windows Azure Architecture, drawing Azure Architecture Diagrams, depicting Azure Cloud System Architecture, describing Azure management, Azure storage, documenting Azure services.
- Energy Conservation Flow Chart Diagram
- Flow Charts On Energy Conservation
- Energy resources diagram | Chart Examples | Chart Templates ...
- Energy resources diagram | Energy Conservation Chart
- Chart Examples | Sources Of Energy Conservation Flowchart
- Energy resources diagram | Solar Energy Conservation Flowchart
- Audit process flowchart (multipage) | Energy resources diagram ...
- Audit process flowchart (multipage) | Energy resources diagram ...
- Energy resources diagram | Drawing On Solar Energy Conservation
- Conservation Of Solar Energy Flow Chart With Images
- Energy resources diagram | Flowchart On Conservation Of Solar ...
- Flow Chart On Conserve Energy
- CMP adaptive management cycle | Audit process flowchart ...
- Audit process flowchart (multipage) | Energy resources diagram ...
- Energy resources diagram | Global Warming Flow Chart
- Energy Conservation And Manegment Pai Chart
- Energy resources diagram | Diagram About Coal Conservation
- Types of Flowcharts | Technical Flow Chart | Energy resources ...
- Chart Showing Conservation Of Resources To Draw
- Energy resources diagram | What Is Global Warming With Flowchart
- ERD | Entity Relationship Diagrams, ERD Software for Mac and Win
- Flowchart | Basic Flowchart Symbols and Meaning
- Flowchart | Flowchart Design - Symbols, Shapes, Stencils and Icons
- Flowchart | Flow Chart Symbols
- Electrical | Electrical Drawing - Wiring and Circuits Schematics
- Flowchart | Common Flowchart Symbols
- Flowchart | Common Flowchart Symbols