 PM Docs
PM Docs solution from ConceptDraw Solution Park extends ConceptDraw MINDMAP software with the ability to create and organize the project and company documentation, to structure information that relates to your project, to link the project documentation to tasks, phases, and resources. This solution contributes for improvement the project management abilities and enhancement the productivity of project team, makes it easier to locate the pertinent documentation over the life of a project, beginning from its planning, improves the document access and minimizes search time, lets to link or embed documentation into the project topics, helps create document, design professional Mind Maps, link the correct documents to keep them organized in a project, sort the project documents and visually differentiate the document types.
HelpDesk
Download and Install ConceptDraw Office on Mac

Ring Network Topology

Gant Chart in Project Management


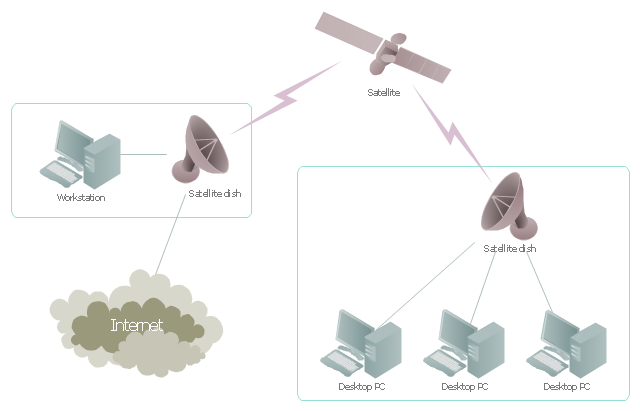
"Satellite Internet access is Internet access provided through communications satellites. ...
Satellite Internet generally relies on three primary components: a satellite in geostationary orbit (sometimes referred to as a geosynchronous Earth orbit, or GEO), a number of ground stations known as gateways that relay Internet data to and from the satellite via radio waves (microwave), and a VSAT (very-small-aperture terminal) dish antenna with a transceiver, located at the subscriber's premises. Other components of a satellite Internet system include a modem at the user end which links the user's network with the transceiver, and a centralized network operations center (NOC) for monitoring the entire system. Working in concert with a broadband gateway, the satellite operates a Star network topology where all network communication passes through the network's hub processor, which is at the center of the star. With this configuration, the number of remote VSATs that can be connected to the hub is virtually limitless." [Satellite Internet access. Wikipedia]
This satellite telecom network diagram example was created using the ConceptDraw PRO diagramming and vector drawing software extended with the Telecommunication Network Diagrams solution from the Computer and Networks area of ConceptDraw Solution Park.
Satellite telecom network diagram
Basic Flowchart Symbols and Meaning


Virtual networks. Computer and Network Examples

Well known forms of network virtualization are virtual networks based on the virtual devices (for example the network based on the virtual devices inside a hypervisor), protocol-based virtual networks (VLAN, VPN, VPLS, Virtual Wireless network, etc.) and their combinations.
This example was created in ConceptDraw PRO using the Computer and Networks Area of ConceptDraw Solution Park and shows the Virtual network.

This picture bar graph sample shows regional population growth from 2010 to 2016. It was designed using data from the Wikipedia article List of continents by population.
[en.wikipedia.org/ wiki/ List_ of_ continents_ by_ population]
"Population geography is a division of human geography. It is the study of the ways in which spatial variations in the distribution, composition, migration, and growth of populations are related to the nature of places. Population geography involves demography in a geographical perspective. It focuses on the characteristics of population distributions that change in a spatial context." [Population geography. Wikipedia]
The pictorial chart example "Regional population growth from 2010 to 2016" was created using the ConceptDraw PRO diagramming and vector drawing software extended with the Picture Graphs solution from the Graphs and Charts area of ConceptDraw Solution Park.
Image chart

Internet solutions with ConceptDraw PRO

Network Glossary Definition

Easy to draw network topology diagrams, network mapping and Cisco network topology.
Gantt charts for planning and scheduling projects

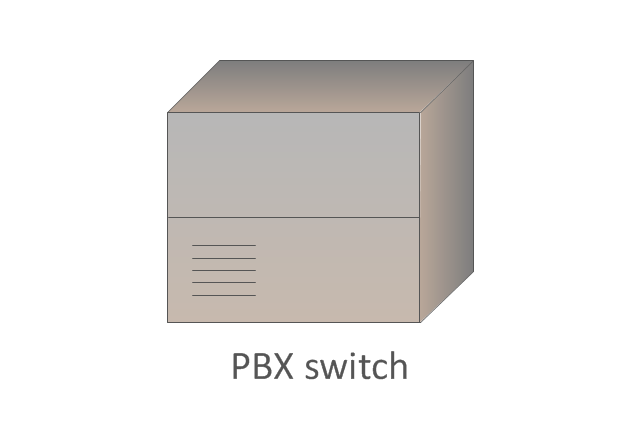
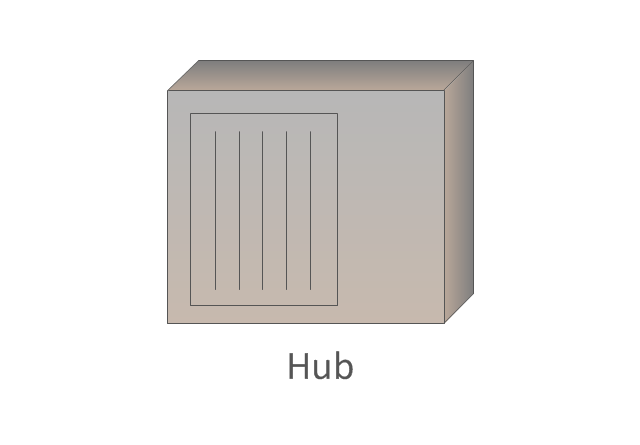
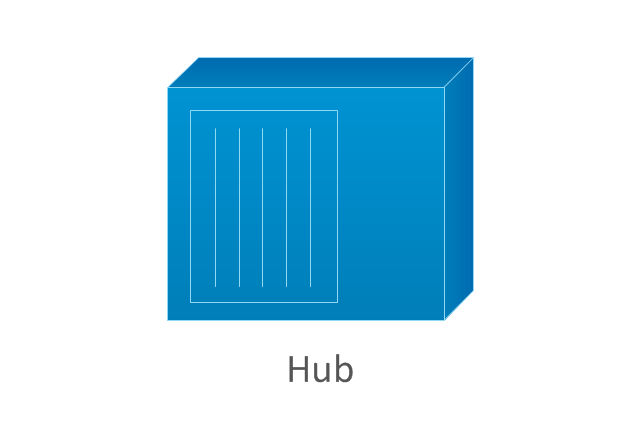
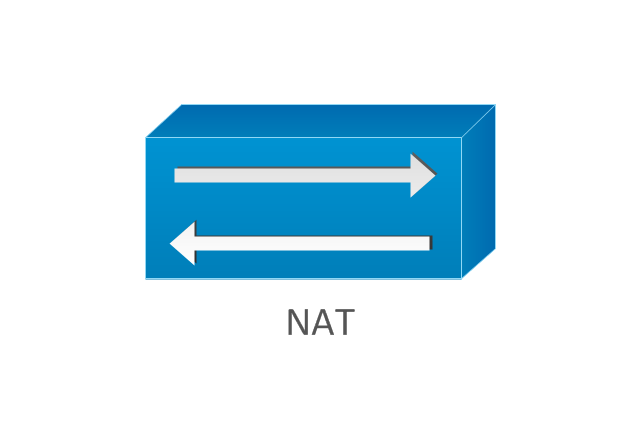
The vector stencils library "Cisco WAN" contains 15 symbols of wide area network (WAN) devices and equipment for drawing Cisco WAN diagrams.
"A wide area network (WAN) is a network that covers a broad area (i.e., any telecommunications network that links across metropolitan, regional, or national boundaries) using leased telecommunication lines. Business and government entities utilize WANs to relay data among employees, clients, buyers, and suppliers from various geographical locations. ...
Related terms for other types of networks are personal area networks (PANs), local area networks (LANs), campus area networks (CANs), or metropolitan area networks (MANs) which are usually limited to a room, building, campus or specific metropolitan area (e.g., a city) respectively.
... it may be best to view WANs as computer networking technologies used to transmit data over long distances, and between different LANs, MANs and other localised computer networking architectures. ...
WANs are often built using leased lines. At each end of the leased line, a router connects the LAN on one side with a second router within the LAN on the other. Leased lines can be very expensive. Instead of using leased lines, WANs can also be built using less costly circuit switching or packet switching methods. Network protocols including TCP/ IP deliver transport and addressing functions. Protocols including Packet over SONET/ SDH, MPLS, ATM and Frame relay are often used by service providers to deliver the links that are used in WANs." [Wide area network. Wikipedia]
The symbols example "Cisco WAN - Vector stencils library" was created using the ConceptDraw PRO diagramming and vector drawing software extended with the Cisco Network Diagrams solution from the Computer and Networks area of ConceptDraw Solution Park.
www.conceptdraw.com/ solution-park/ computer-networks-cisco
CSU/DSU
WAN
MUX
PBX switch
Hub
Hub, blue
NAT
Network cloud, dark
Network cloud, gold
Network cloud, white
Network cloud, standard color
Distributed director
Local director
PBX
DPT
IDEF1X Standard

UML Notation

Two types of diagrams are used in UML: Structure Diagrams and Behavior Diagrams. Behavior Diagrams represent the processes proceeding in a modeled environment. Structure Diagrams represent the elements that compose the system.
Databases Access Objects Model with ConceptDraw PRO

- Events BPMN 1.2 - Vector stencils library | PM Docs | Basic ...
- Events BPMN 1.2 - Vector stencils library | Design elements - Events ...
- Events BPMN 1.2 - Vector stencils library | How to Edit a Project ...
- Events BPMN 1.2 - Vector stencils library | Basic Flowchart Symbols ...
- Events BPMN 1.2 - Vector stencils library | Design elements - Events ...
- Events BPMN 1.2 - Vector stencils library | Design elements - Events ...
- Events BPMN 1.2 - Vector stencils library | Design elements - Events ...
- Events BPMN 1.2 - Vector stencils library | Design elements - Events ...
- Events BPMN 1.2 - Vector stencils library | Expanded objects BPMN ...
- Events BPMN 1.2 - Vector stencils library | Design elements - Events ...
- Events BPMN 1.2 - Vector stencils library | Basic Flowchart Symbols ...
- Events BPMN 1.2 - Vector stencils library | Messages - Vector ...
- Events BPMN 1.2 - Vector stencils library | Business process model ...
- Events BPMN 1.2 - Vector stencils library | Expanded objects BPMN ...
- Activities BPMN 1.2 - Vector stencils library | Design elements ...
- Active Directory diagram - Site links | Computer network - Vector ...
- Computer pictograms - Vector stencils library | Events BPMN 1.2 ...
- UML component diagram - Start server | How to Operate with Project ...
- Design elements - Events BPMN 2.0 | Events - Vector stencils library ...
- Mobile satellite communication network diagram | Hybrid satellite ...
- ERD | Entity Relationship Diagrams, ERD Software for Mac and Win
- Flowchart | Basic Flowchart Symbols and Meaning
- Flowchart | Flowchart Design - Symbols, Shapes, Stencils and Icons
- Flowchart | Flow Chart Symbols
- Electrical | Electrical Drawing - Wiring and Circuits Schematics
- Flowchart | Common Flowchart Symbols
- Flowchart | Common Flowchart Symbols