 HR Flowcharts
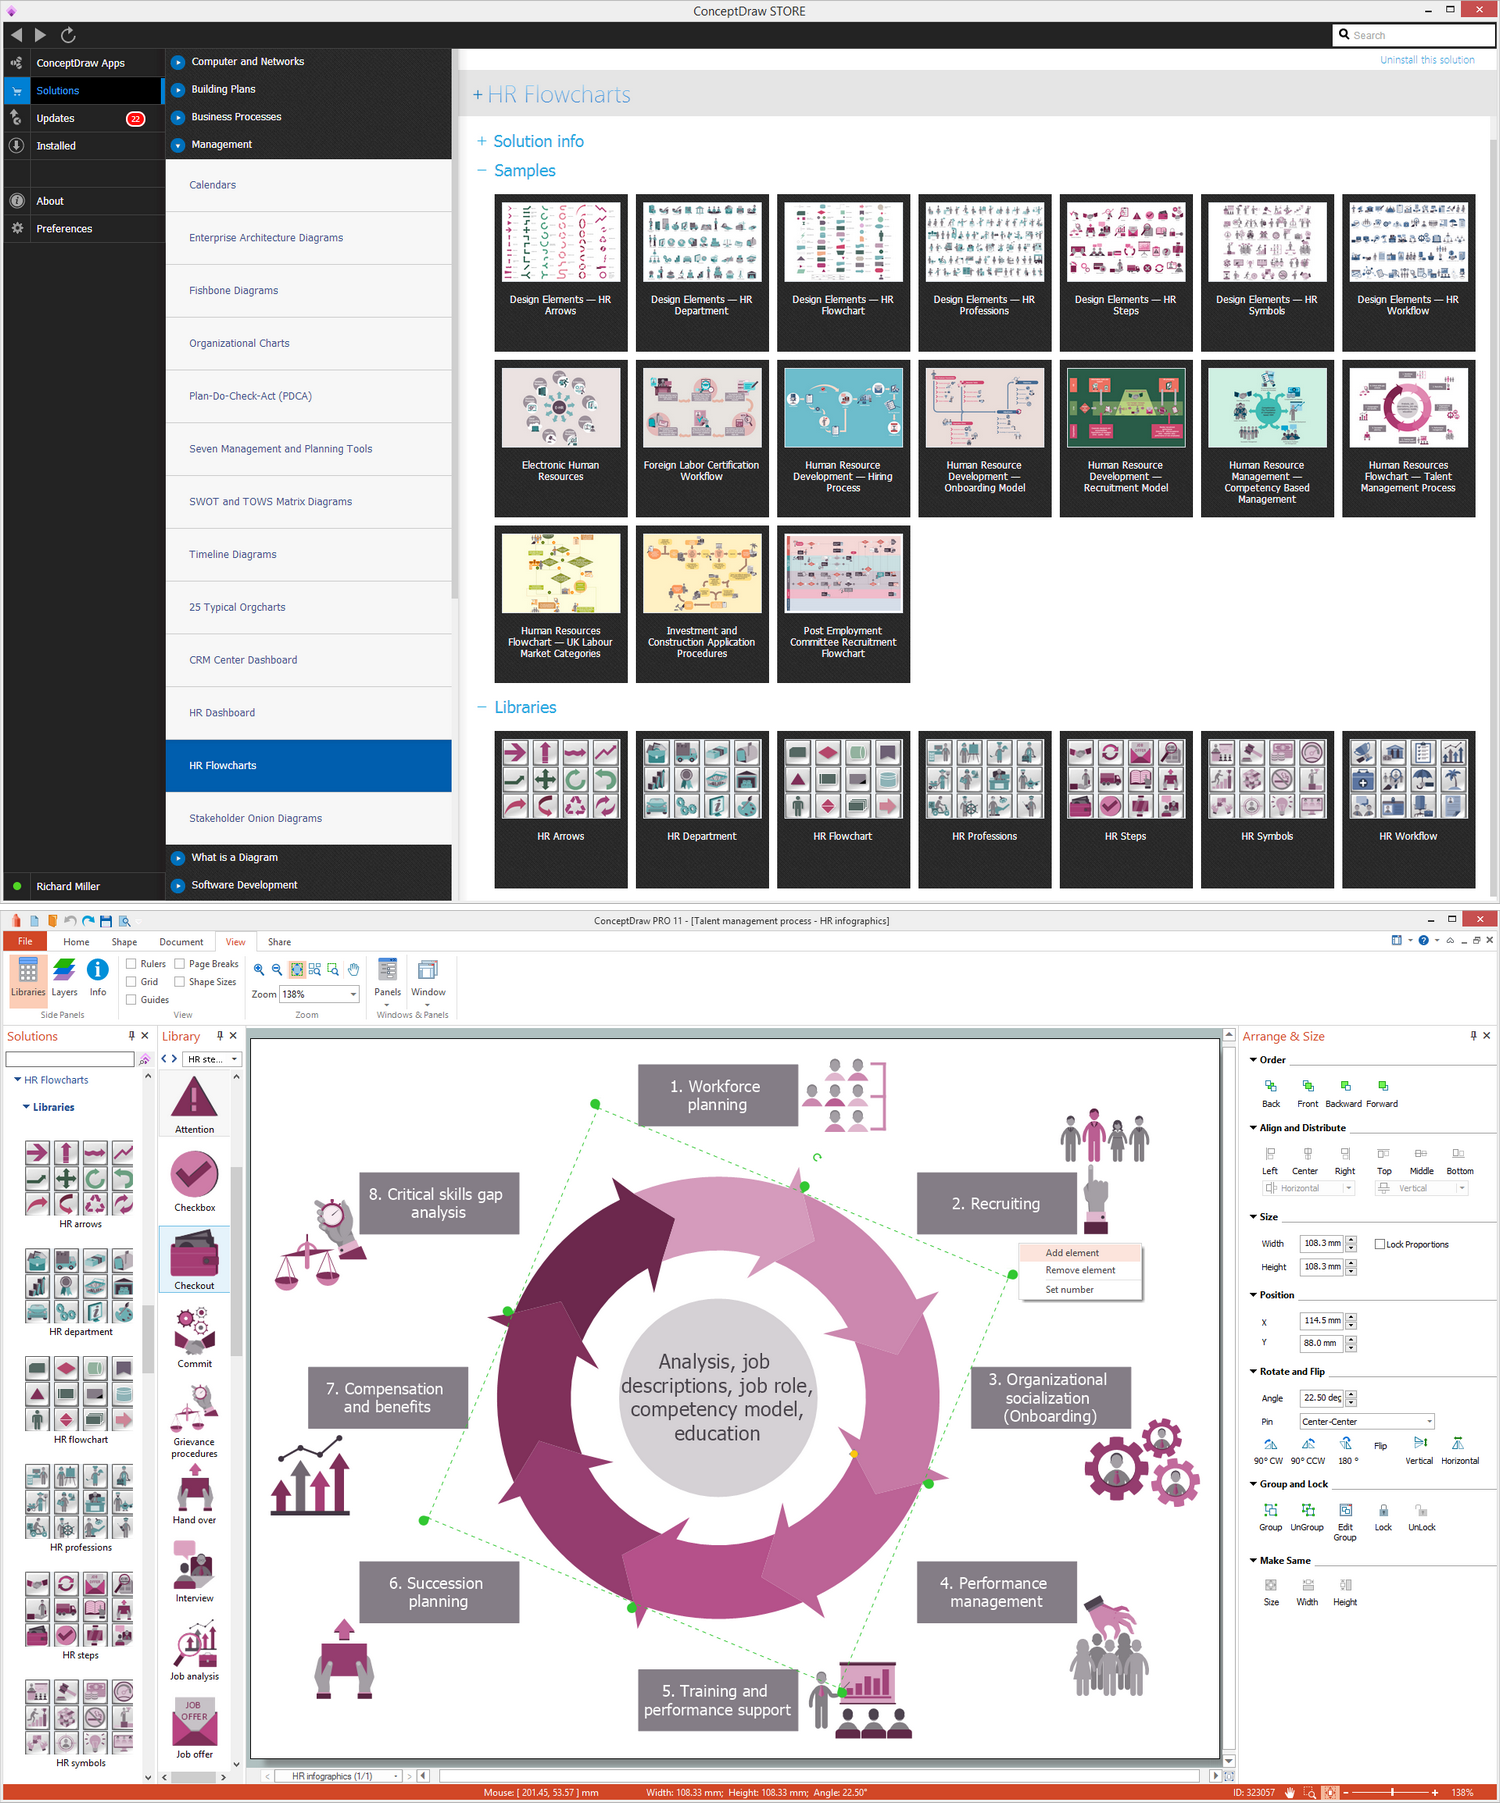
Human resource management diagrams show recruitment models, the hiring process and human resource development of human resources.
Human Resource Management

Human Resources
Using Fishbone Diagrams for Problem Solving

Using Fishbone Diagrams for Problem Solving is a productive and illustrative tool to identify the most important factors causing the trouble. ConceptDraw DIAGRAM extended with Fishbone Diagrams solution from the Management area of ConceptDraw Solution Park is a powerful tool for problem solving with Fishbone Ishikawa diagram graphic method.
HR Flowchart Symbols

Pyramid Diagram

Fishbone Diagram Problem Solving

To design easily the Fishbone diagram, you can use a special ConceptDraw DIAGRAM vector graphic and diagramming software which contains the powerful tools for Fishbone diagram problem solving offered by Fishbone Diagrams solution for the Management area of ConceptDraw Solution Park.
 Fishbone Diagrams
The Fishbone Diagrams solution extends ConceptDraw DIAGRAM software with the ability to easily draw the Fishbone Diagrams (Ishikawa Diagrams) to clearly see the cause and effect analysis and also problem solving. The vector graphic diagrams produced using this solution can be used in whitepapers, presentations, datasheets, posters, and published technical material.
 ConceptDraw Dashboard for Facebook
ConceptDraw Dashboard for Facebook solution extends ConceptDraw DIAGRAM software with a dynamically updated visual dashboard, which shows lifetime total likes, daily friends of fans, and daily page views, information you can receive from Facebook Insights.
SWOT Template

- Employee Motivation Chart
- HR Flowcharts | Flow Chart Diagram Of Motivation For Employee
- Motivation Chart By Diagram
- HR Flowchart Symbols | HR Flowcharts | Fishbone Diagram ...
- HR Flowchart Symbols | Bubble Chart | Example Of Motivation Icons
- The Best Choice for Creating Diagram | ConceptDraw Arrows10 ...
- Motivational Flow Chart
- Motivation Flowchart
- Motivation Theories Concepts With Flowchart And Diagram
- Bubble Diagrams | How to Add a Bubble Diagram to a PowerPoint ...
- ERD | Entity Relationship Diagrams, ERD Software for Mac and Win
- Flowchart | Basic Flowchart Symbols and Meaning
- Flowchart | Flowchart Design - Symbols, Shapes, Stencils and Icons
- Flowchart | Flow Chart Symbols
- Electrical | Electrical Drawing - Wiring and Circuits Schematics
- Flowchart | Common Flowchart Symbols
- Flowchart | Common Flowchart Symbols