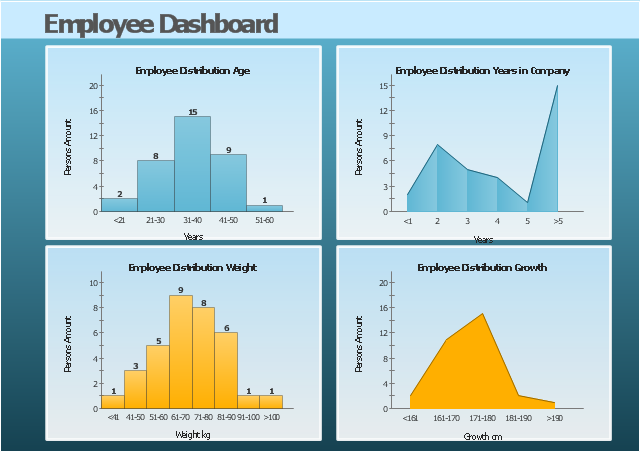
This HR dashboard example include histograms "Employee Distribution by Age" and "Employee Distribution by Weight", and area charts "Employee Distribution by Years in Company" and "Employee Distribution by Growth".
"Human resource management (HRM, or simply HR) is the management process of an organization's workforce, or human resources. It is responsible for the attraction, selection, training, assessment, and rewarding of employees, while also overseeing organizational leadership and culture and ensuring compliance with employment and labor laws. In circumstances where employees desire and are legally authorized to hold a collective bargaining agreement, HR will also serve as the company's primary liaison with the employees' representatives (usually a trades union)." [Human resource management. Wikipedia]
The example "Employee dashboard" was created using the ConceptDraw PRO diagramming and vector drawing software extended with the Frequency Distribution Dashboard solution from the area "What is a Dashboard" of ConceptDraw Solution Park.
Visual dashboard
 Frequency Distribution Dashboard
Frequency distribution dashboard solution extends ConceptDraw PRO software with samples, templates and vector stencils libraries with histograms and area charts for drawing the visual dashboards showing frequency distribution of data.
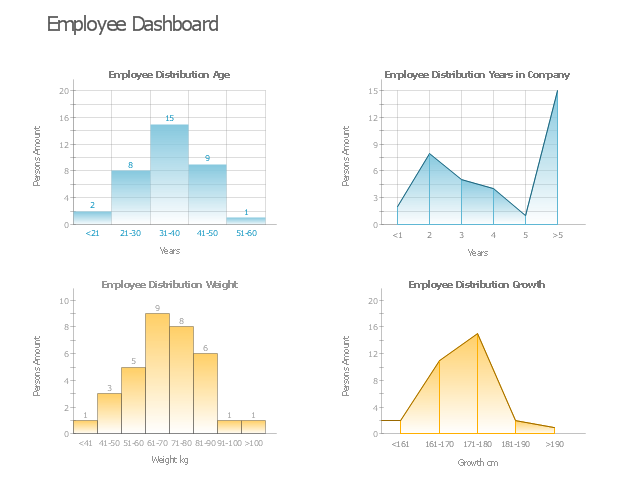
This HR dashboard example include histograms "Employee Distribution by Age" and "Employee Distribution by Weight", and area charts "Employee Distribution by Years in Company" and "Employee Distribution by Growth".
"Human resources is the set of individuals who make up the workforce of an organization, business sector, or economy. "Human capital" is sometimes used synonymously with human resources, although human capital typically refers to a more narrow view (i.e., the knowledge the individuals embody and can contribute to an organization). Likewise, other terms sometimes used include "manpower", "talent", "labour", or simply "people". The professional discipline and business function that oversees an organization's human resources is called human resource management (HRM, or simply HR)." [Human resources. Wikipedia]
The example "HR dashboard" was created using the ConceptDraw PRO diagramming and vector drawing software extended with the Frequency Distribution Dashboard solution from the area "What is a Dashboard" of ConceptDraw Solution Park.
Visual dashboard
This example was created on the base of the Georgia DOT Performance Management Dashboard from the Georgia Department of Transportation website.
[dot.ga.gov/ informationcenter/ statistics/ performance/ Pages/ default.aspx]
"Performance management (PM) includes activities which ensure that goals are consistently being met in an effective and efficient manner. Performance management can focus on the performance of an organization, a department, employee, or even the processes to build a product of service, as well as many other areas.
PM is also known as a process by which organizations align their resources, systems and employees to strategic objectives and priorities.
Performance management originated as a broad term coined by Dr. Aubrey Daniels in the late 1970s to describe a technology (i.e. science imbedded in applications methods) for managing both behavior and results, two critical elements of what is known as performance. A formal definition of performance management, according to Daniels' is "a scientifically based, data-oriented management system. It consists of three primary elements-measurement, feedback and positive reinforcement."" [Performance management. Wikipedia]
The meter dashboard example "Georgia DOT Performance Management" was created using the ConceptDraw PRO diagramming and vector drawing software extended with the Meter Dashboard solution from the area "What is a Dashboard" of ConceptDraw Solution Park.
Meter dashboard

"As a discipline, task management embraces several key activities. Various conceptual breakdowns exist, and these, at a high-level, always include creative, functional, project, performance and service activities.
Creative activities pertain to task creation. In context, these should allow for task planning, brainstorming, creation, elaboration, clarification, organization, reduction, targeting and preliminary prioritization.
Functional activities pertain to personnel, sales, quality or other management areas, for the ultimate purpose of ensuring production of final goods and services for delivery to customers. In context these should allow for planning, reporting, tracking, prioritizing, configuring, delegating, and managing of tasks.
Project activities pertain to planning and time and costs reporting. These can encompass multiple functional activities but are always greater and more purposeful than the sum of its parts. In context project activities should allow for project task breakdown, task allocation, inventory across projects, and concurrent access to task databases.
Service activities pertain to client and internal company services provision, including customer relationship management and knowledge management. In context these should allow for file attachment and links to tasks, document management, access rights management, inventory of client & employee records, orders & calls management, and annotating tasks.
Performance activities pertain to tracking performance and fulfillment of assigned tasks. In context these should allow for tracking by time, cost control, stakeholders and priority; charts, exportable reports, status updates, deadline adjustments, and activity logging.
Report activities pertain to the presentation of information regarding the other five activities listed, including graphical display." [Task management. Wikipedia]
The example "Project tasks dashboard" was created using the ConceptDraw PRO diagramming and vector drawing software extended with the Status Dashboard solution from the area "What is a Dashboard" of ConceptDraw Solution Park.
Project tasks dashboard

 Meter Dashboard
Meter dashboard solution extends ConceptDraw PRO software with templates, samples and vector stencils library with meter indicators for drawing visual dashboards showing quantitative data.
 ConceptDraw Dashboard for Facebook
ConceptDraw Dashboard for Facebook solution extends ConceptDraw PRO software with a dynamically updated visual dashboard, which shows lifetime total likes, daily friends of fans, and daily page views, information you can receive from Facebook Insights.
 25 Typical Orgcharts
The 25 Typical Orgcharts solution contains powerful organizational structure and organizational management drawing tools, a variety of professionally designed organization chart and matrix organization structure samples, 25 templates based on various orga
 HR Flowcharts
Human resource management diagrams show recruitment models, the hiring process and human resource development of human resources.
 Workflow Diagrams
Workflow Diagrams solution extends ConceptDraw PRO software with samples, templates and vector stencils library for drawing the work process flowcharts.
The vector stencils library "Sales KPIs and Metrics" contains 15 chart templates and graphic indicators of sales key performance indicators (KPIs) and metrics for drawing sales dashboards: line charts "Cost per order" and "Clicks from Sales Follow-Up Emails", column charts "Social Media Usage" and "Usage Rate of Marketing Collateral", horizontal bar charts "Rate of Follow Up Contact", "Cost per customer" and "Lead Response Time", pie charts "Product mix", "Product Performance" and "Rate of Contact", gauge (speedometer) indicators "Sales Growth" and "Actual vs Plan", bullet indicator "Sales Target", diamond alarm indicators "Average Purchase Value", "Quote to Close Ratio", "Opportunity-to-Win Ratio" and "Sales Ratio".
The dashboard charts and indicators example "Design elements - Sales KPIs and metrics" for the ConceptDraw PRO diagramming and vector drawing software is included in the Sales Dashboard solution from the Marketing area of ConceptDraw Solution Park.
www.conceptdraw.com/ solution-park/ marketing-sales-dashboard
Sales dashboard charts and graphic indicators


HelpDesk
Replace Your Current Diagramming Tool

 ConceptDraw Solution Park
ConceptDraw Solution Park collects graphic extensions, examples and learning materials
 AWS Architecture Diagrams
The flexible AWS cloud solutions will help you to create reliable applications with a high level of scaling in the AWS cloud, to run your applications and accelerate their work on the level of security. Besides AWS resources are available worldwide and yo
- Employee distribution - HR dashboard | Frequency Distribution ...
- HR dashboard | Projects HR dashboard | Employee distribution - HR ...
- Employee distribution - HR dashboard | Projects HR dashboard | HR ...
- Employee distribution - HR dashboard | How to Create a HR ...
- Employee Retention Dashboard
- Employee distribution - HR dashboard | HR dashboard | Projects HR ...
- Employee Discipline Dashboard
- Employee distribution - HR dashboard | ConceptDraw PRO: Able to ...
- Other Terms For Employee Dashboard
- Strategy Map | Employee Attrition Dashboard
- Employee distribution - HR dashboard | HR dashboard | Frequency ...
- Employee distribution - HR dashboard | Georgia DOT performance ...
- Projects HR dashboard | Employee distribution - HR dashboard ...
- Sample Employee Dashboard
- Employee Kpi Dashboard
- Employee Performance Dashboard Template In Excel
- Other Name For Employee Dashboard
- Employee Tasks Dashboards
- UK labour market categories | Employee distribution - HR ...
- Employee distribution - HR dashboard | HR Flowcharts | School and ...
- ERD | Entity Relationship Diagrams, ERD Software for Mac and Win
- Flowchart | Basic Flowchart Symbols and Meaning
- Flowchart | Flowchart Design - Symbols, Shapes, Stencils and Icons
- Flowchart | Flow Chart Symbols
- Electrical | Electrical Drawing - Wiring and Circuits Schematics
- Flowchart | Common Flowchart Symbols
- Flowchart | Common Flowchart Symbols