"Online advertising, also called Internet advertising, uses the Internet to deliver promotional marketing messages to consumers. It includes email marketing, search engine marketing, social media marketing, many types of display advertising (including web banner advertising), and mobile advertising. Like other advertising media, online advertising frequently involves both a publisher, who integrates advertisements into its online content, and an advertiser, who provides the advertisements to be displayed on the publisher's content. Other potential participants include advertising agencies who help generate and place the ad copy, an ad server who technologically delivers the ad and tracks statistics, and advertising affiliates who do independent promotional work for the advertiser." [Online advertising. Wikipedia]
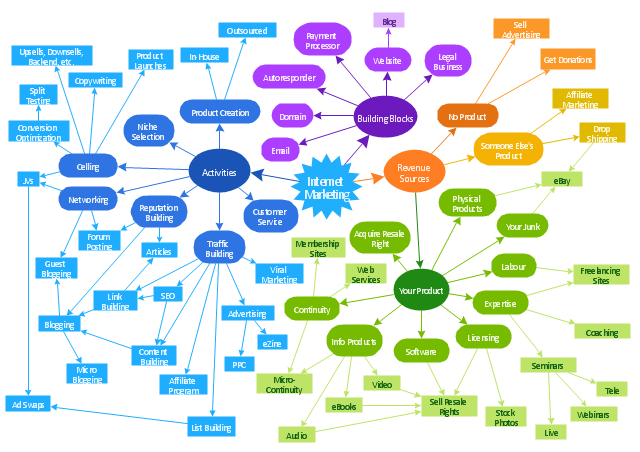
The concept map example "Internet marketing" was created using the ConceptDraw PRO diagramming and vector drawing software extended with the Concept Maps solution from the area "What is a Diagram" of ConceptDraw Solution Park.
The concept map example "Internet marketing" was created using the ConceptDraw PRO diagramming and vector drawing software extended with the Concept Maps solution from the area "What is a Diagram" of ConceptDraw Solution Park.
Concept map
This Venn diagram sample shows the relations between Internet marketing professions.
"Online advertising, also called Internet advertising, uses the Internet to deliver promotional marketing messages to consumers. It includes email marketing, search engine marketing, social media marketing, many types of display advertising (including web banner advertising), and mobile advertising. Like other advertising media, online advertising frequently involves both a publisher, who integrates advertisements into its online content, and an advertiser, who provides the advertisements to be displayed on the publisher's content. Other potential participants include advertising agencies who help generate and place the ad copy, an ad server who technologically delivers the ad and tracks statistics, and advertising affiliates who do independent promotional work for the advertiser." [Online advertising. Wikipedia]
The diagram example "Internet marketing professions" was created using the ConceptDraw PRO diagramming and vector drawing software extended with the Venn Diagrams solution from the area "What is a Diagram" of ConceptDraw Solution Park.
Venn diagram

Business and Finance Illustrations

The Business and Finance solution contains 12 vector clipart libraries: Advertising, Business, Business people clipart, Business people figures, Currency, Mail and post, Management, Marketing, Money, Office, Project management, Time
Watercraft - Design Elements

Use it to draw illustrations of vessels and water transport over a sea, ocean, lake, canal, river.
This wheel diagram sample was created on the base of figure illustrating the webpage "Chapter 3: Current State of the Ecosystem" of the website of the National Broadband Plan of US Federal Communications Comission (FCC). "The broadband ecosystem includes applications and content: e-mail, search, news, maps, sales and marketing applications used by businesses, user-generated video and hundreds of thousands of more specialized uses. Ultimately, the value of broadband is realized when it delivers useful applications and content to end-users.
Applications run on devices that attach to the network and allow users to communicate: computers, smartphones, set-top boxes, e-book readers, sensors, private branch exchanges (PBX), local area network routers, modems and an ever-growing list of other devices. New devices mean new opportunities for applications and content.
Finally, broadband networks can take multiple forms: wired or wireless, fixed or mobile, terrestrial or satellite. Different types of networks have different capabilities, benefits and costs.
The value of being connected to the network increases as more people and businesses choose to adopt broadband and use applications and devices that the network supports. Several factors contribute to their decisions. These include whether they can afford a connection, whether they are comfortable with digital technology and whether they believe broadband is useful.
Networks, devices and applications drive each other in a virtuous cycle. If networks are fast, reliable and widely available, companies produce more powerful, more capable devices to connect to those networks. These devices, in turn, encourage innovators and entrepreneurs to develop exciting applications and content. These new applications draw interest among end-users, bring new users online and increase use among those who already subscribe to broadband services. This growth in the broadband ecosystem reinforces the cycle, encouraging service providers to boost the speed, functionality and reach of their networks."
[broadband.gov/ plan/ 3-current-state-of-the-ecosystem/ ]
The circle pie chart example "Forces shaping the broadband ecosystem in the US" was created using the ConceptDraw PRO diagramming and vector drawing software extended with the Target and Circular Diagrams solution from the Marketing area of ConceptDraw Solution Park.
www.conceptdraw.com/ solution-park/ marketing-target-and-circular-diagrams
Wheel diagram

Marketing Organization Chart

HelpDesk
How to Send an Outlook Email From a Mind Map

Growth-Share Matrix Software

The Matrices Solution also provides a wide variety of templates and samples that will help you to create the Matrix diagrams of any difficulty.
Deployment Chart Software

The Matrices solution offers you the useful tools for creating Deployment Charts in just minutes.
The Deployment Charts designed with ConceptDraw PRO are vector graphic documents and are available for reviewing, modifying, converting to a variety of formats (image, HTML, PDF file, MS PowerPoint Presentation, Adobe Flash or MS Visio XML), printing and send via e-mail in one moment.
Marketing and Sales Organization chart. Organization chart Example

This sample shows the Organizational Chart that displays the Sales and marketing (CRM) module. Using the ready-to-use predesigned objects, samples and templates from the Organizational Charts Solution for ConceptDraw PRO you can create your own orgchart professional quick and easy.
Relative Value Chart Software

Relative values are widely used in:business, economics, investment, management, marketing, statistics, etc.
ConceptDraw PRO software is the best for drawing professional looking Relative Value Charts. ConceptDraw PRO provides Divided Bar Diagrams solution from the Graphs and Charts Area of ConceptDraw Solution Park.
Basic Flowchart Symbols and Meaning


Venn Diagram

Process Flowchart


- Email Marketing Process Flow Chart
- Email Marketing Deployment Issue Graph Analysis Examples
- Email Marketing Workflow Diagram
- What Is a Concept Map | Concept Maps | Internet marketing ...
- Marketing Organization Chart | Marketing Charts | Gant Chart in ...
- Internet marketing professions | Basic Venn diagram - Internet ...
- Flowchart Marketing Process. Flowchart Examples | Flowchart ...
- Internet Marketing Infographic | Internet marketing professions ...
- Basic Venn diagram - Internet marketing professions | Internet ...
- Examples Of Marketing Concept
- What Is a Concept Map | Internet marketing - Concept map | Internet ...
- Internet Connectivity. Computer and Network Examples | Satellite ...
- Internet marketing - Concept map | Flowchart Marketing Process ...
- Marketing Diagrams | Internet marketing professions | Marketing ...
- Block diagram - Marketing targeting | Internet marketing professions ...
- What Is a Concept Map | Internet marketing - Concept map | Concept ...
- Online Marketing Objectives | Internet marketing professions ...
- Presentation Clipart | Business People Clipart | Marketing - Design ...
- Internet marketing - Concept map | Leaky bucket diagram | What Is a ...
- Concept Maps | Internet marketing professions | Concept Maps ...
- ERD | Entity Relationship Diagrams, ERD Software for Mac and Win
- Flowchart | Basic Flowchart Symbols and Meaning
- Flowchart | Flowchart Design - Symbols, Shapes, Stencils and Icons
- Flowchart | Flow Chart Symbols
- Electrical | Electrical Drawing - Wiring and Circuits Schematics
- Flowchart | Common Flowchart Symbols
- Flowchart | Common Flowchart Symbols