How can you illustrate the weather condition

Aerospace - Design Elements

The vector stencils library Weather contains 17 symbols of meteorological conditions: sunny, cloudy, overcast, snow, rain, lighting, hot, warm, cold, mist, strong wind, flood, tsunami, dew, hoarfrost, earthquake, snowflake.
Use the design elements library Weather to draw illustrations, calendars, maps and infographics with weather phenomena clipart using the ConceptDraw PRO diagramming and vector graphics software.
"Weather is the state of the atmosphere, to the degree that it is hot or cold, wet or dry, calm or stormy, clear or cloudy. Most weather phenomena occur in the troposphere, just below the stratosphere. Weather generally refers to day-to-day temperature and precipitation activity, whereas climate is the term for the average atmospheric conditions over longer periods of time. When used without qualification, "weather" is understood to mean the weather of Earth." [Weather. Wikipedia]
This example of weather clipart is included in the Nature solution from the Illustration area of ConceptDraw Solution Park.
Vector clip art

Beautiful Nature Scene: Drawing

How to Draw a Natural Landscape

Use Geography library of vector stencils to draw natural landscapes.
Nature Drawings - How to Draw

Beauty in nature Illustrations and Clipart

Drawing Illustration

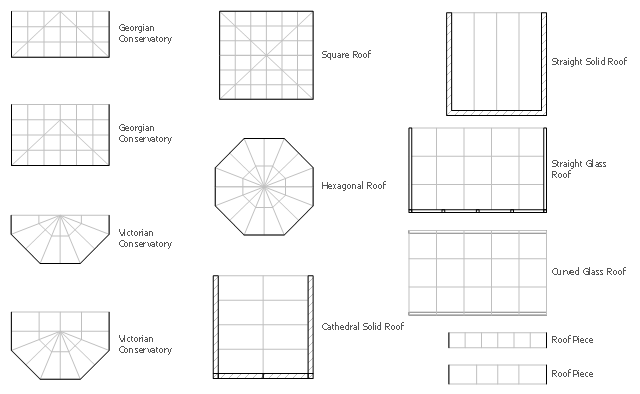
The design elements library Sunrooms contains 12 symbols of glass roof and conservatory.
Use the vector stencils library Sunrooms to draw the sunroom design plans, home layouts, architectural and construction documents.
"A sunroom, sun parlor, sun porch, or sun lounge is a structure usually constructed onto the side of a house which allows enjoyment of the surrounding landscape while being sheltered from adverse weather conditions such as rain and wind. It can be referred to as a patio room, solarium, conservatory or Florida room. The concept is popular in the United States, Europe, Canada, Australia, and New Zealand.
In Great Britain, the term conservatory is usually used to refer to a sunroom despite not being used as a greenhouse as traditional conservatories were. However, sunrooms with opaque roofs may be considered distinct from conservatories with transparent or semi-transparent roofs." [Sunroom. Wikipedia]
The shapes library Sunrooms is provided by the Floor Plans solution from the Building Plans area of ConceptDraw Solution Park.
Types of Flowcharts


Work Flow Process Chart

 USA Maps
Use the USA Maps solution to create a map of USA, a US interstate map, printable US maps, US maps with cities and US maps with capitals. Create a complete USA states map.
Drawing a Nature Scene

Design Pictorial Infographics. Design Infographics

- How can you illustrate the weather condition | Design elements ...
- How can you illustrate the weather condition | Design elements ...
- Aerospace - Design Elements | How can you illustrate the weather ...
- How can you illustrate the weather condition | Workflow diagram ...
- Sunny Elements Of Weather Drawings
- Design elements - Weather | How can you illustrate the weather ...
- How can you illustrate the weather condition | Aerospace - Design ...
- The Elements Of Cloudy Weather
- Nature Clipart and Illustrations | Design elements - Weather | How ...
- Design elements - Weather | Weather - Vector stencils library ...
- Diagrams Of Weather Symbols
- Weather Condition Symbols
- Weather Conditions Diagrams
- Design elements - Weather | Weather - Vector stencils library ...
- Design elements - Weather | Design elements - Weather | Weather ...
- How can you illustrate the weather condition | Nature Clipart and ...
- Design elements - Weather
- How can you illustrate the weather condition | Nature Clipart and ...
- Weather - Vector stencils library | How can you illustrate the weather ...
- Workflow diagram - Weather forecast | Weather - Vector stencils ...
- ERD | Entity Relationship Diagrams, ERD Software for Mac and Win
- Flowchart | Basic Flowchart Symbols and Meaning
- Flowchart | Flowchart Design - Symbols, Shapes, Stencils and Icons
- Flowchart | Flow Chart Symbols
- Electrical | Electrical Drawing - Wiring and Circuits Schematics
- Flowchart | Common Flowchart Symbols
- Flowchart | Common Flowchart Symbols