Electrical Engineering
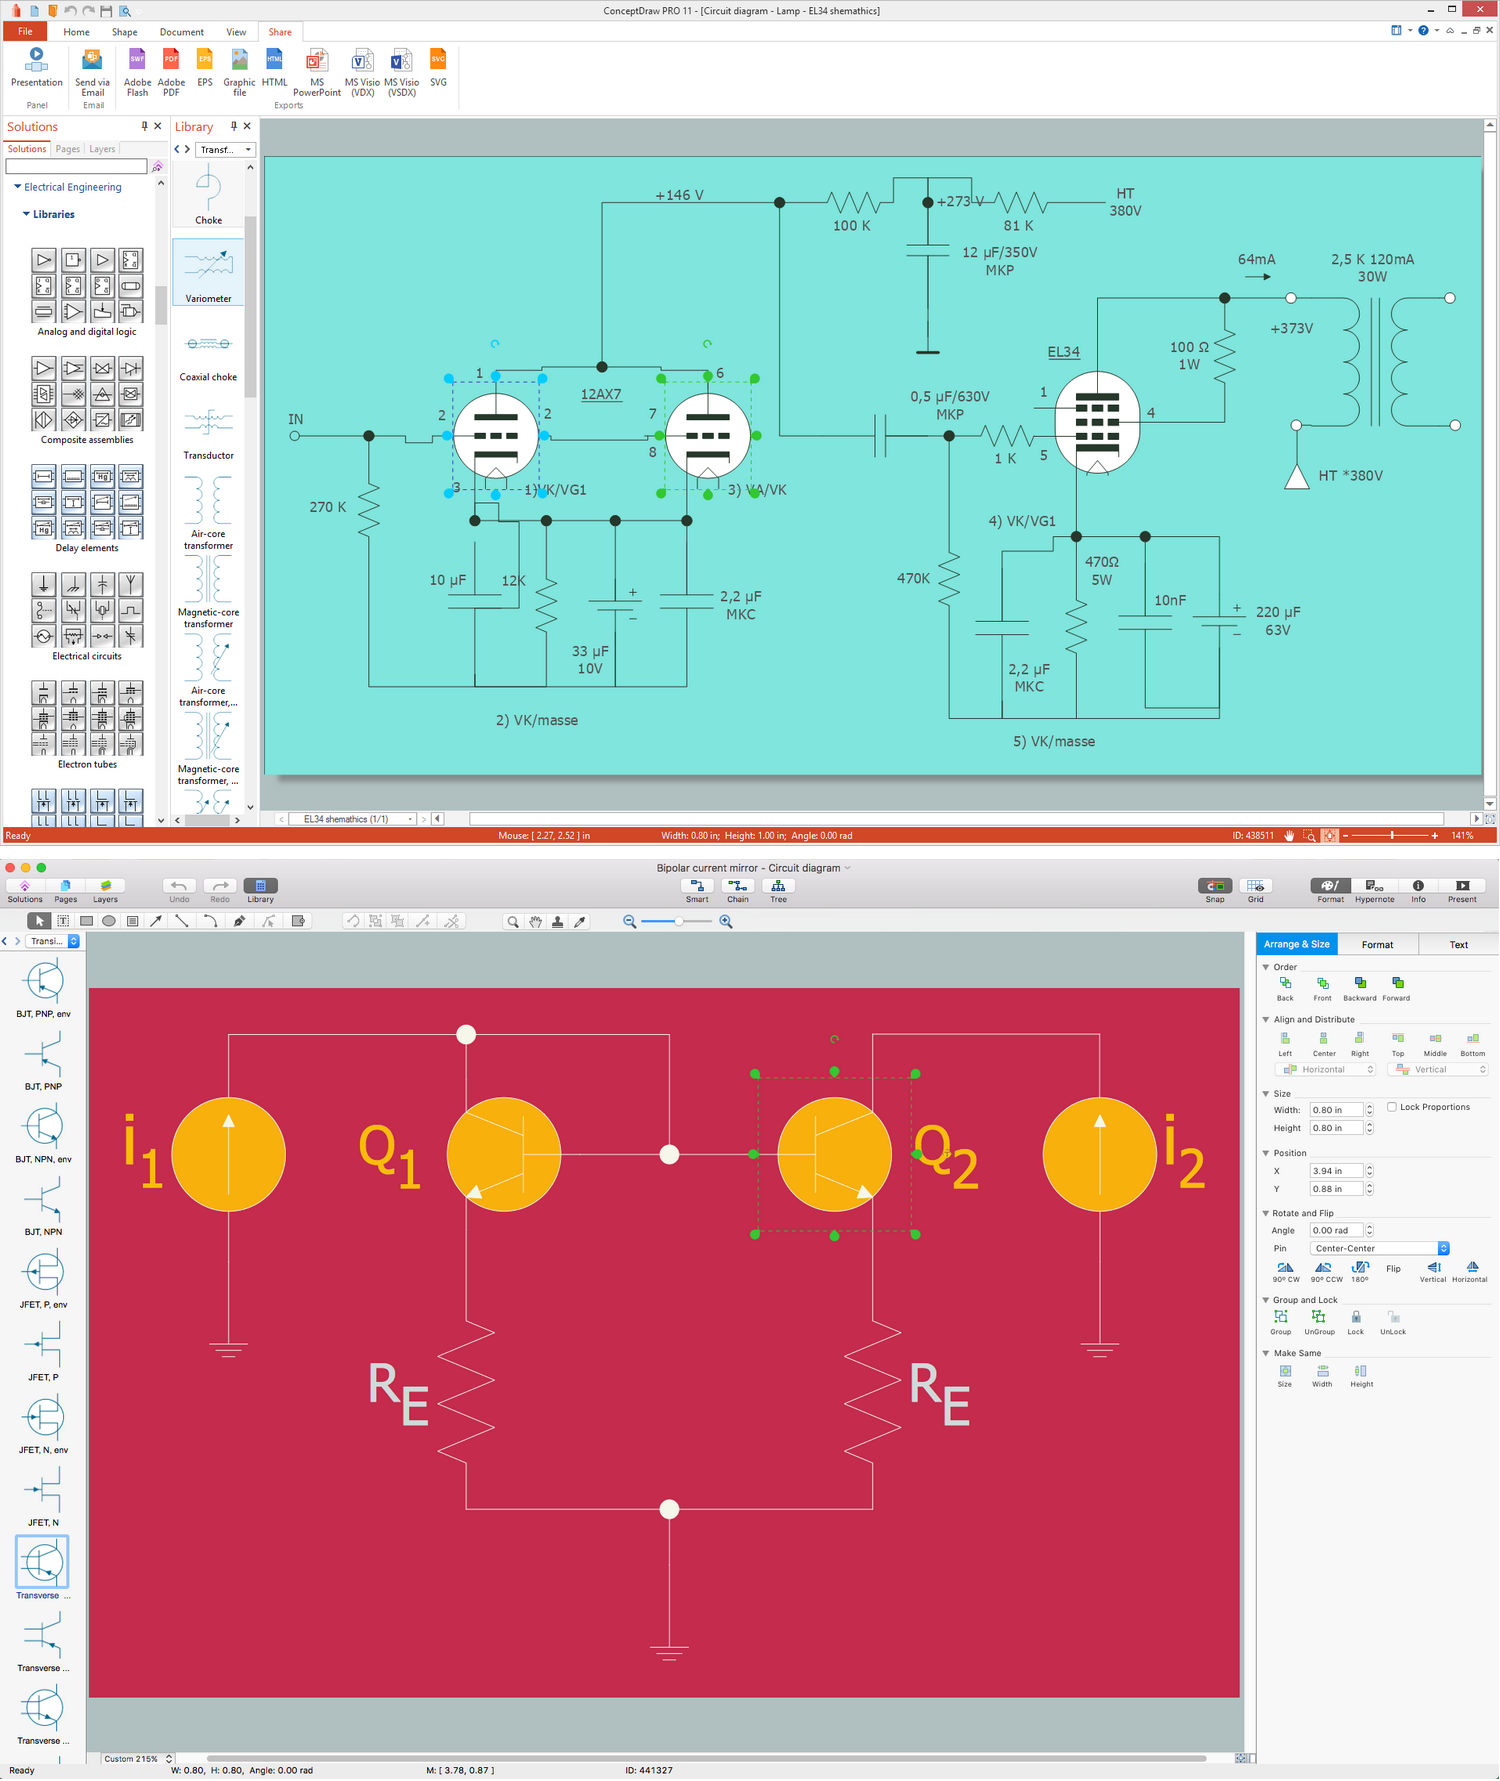
Circuits and Logic Diagram Software

Electrical Engineering solution helps you create quick and easy: Electrical schematics, Digital and analog logic designs, Circuit and wiring schematics and diagrams, Power systems diagrams, Maintenance and repair diagrams, Circuit board and amplifier diagrams, Integrated circuit schematics.
ERD Symbols and Meanings

The Chen's ERD notation is still used and is considered to present a more detailed way of representing entities and relationships.
To create an ERD, software engineers mainly turn to dedicated drawing software, which contain the full notation resources for their specific database design - ERD symbols and meanings. CS Odessa has released an all-inclusive Entity-Relationship Diagram (ERD) solution for their powerful drawing program, ConceptDraw DIAGRAM.

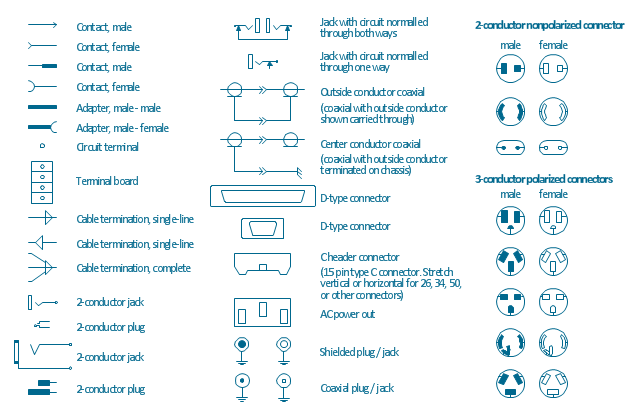
The vector stencils library "Terminals and connectors" contains 43 element symbols of terminals, connectors, plugs, polarized connectors, jacks, coaxial cables, and conductors.
Use it for drawing the wiring diagrams, electrical layouts, electronic schematics, and circuit diagrams.
"An electrical connector is an electro-mechanical device for joining electrical circuits as an interface using a mechanical assembly. Connectors consist of plugs (male-ended) and jacks (female-ended). The connection may be temporary, as for portable equipment, require a tool for assembly and removal, or serve as a permanent electrical joint between two wires or devices. An adapter can be used to effectively bring together dissimilar connectors.
There are hundreds of types of electrical connectors. Connectors may join two lengths of flexible copper wire or cable, or connect a wire or cable or optical interface to an electrical terminal.
In computing, an electrical connector can also be known as a physical interface... Cable glands, known as cable connectors in the US, connect wires to devices mechanically rather than electrically and are distinct from quick-disconnects performing the latter." [Electrical connector. Wikipedia]
"A terminal is the point at which a conductor from an electrical component, device or network comes to an end and provides a point of connection to external circuits. A terminal may simply be the end of a wire or it may be fitted with a connector or fastener. In network analysis, terminal means a point at which connections can be made to a network in theory and does not necessarily refer to any real physical object. In this context, especially in older documents, it is sometimes called a "pole".
The connection may be temporary, as seen in portable equipment, may require a tool for assembly and removal, or may be a permanent electrical joint between two wires or devices.
All electric cell have two terminals. The first is the positive terminal and the second is the negative terminal. The positive terminal looks like a metal cap and the negative terminal looks like a metal disc. The current flows from the positive terminal, and out through the negative terminal, replicative of current flow (positive (+) to negative (-) flow)." [Terminal (electronics). Wikipedia]
The shapes example "Design elements - Terminals and connectors" was drawn using the ConceptDraw PRO diagramming and vector drawing software extended with the Electrical Engineering solution from the Engineering area of ConceptDraw Solution Park.
Terminal and connector symbols
Venn Diagram Examples for Problem Solving. Computer Science. Chomsky Hierarchy

The Venn diagram example below visualizes the the class of language inclusions described by the Chomsky hierarchy.
Venn Diagram Examples for Problem Solving. Venn Diagram as a Truth Table

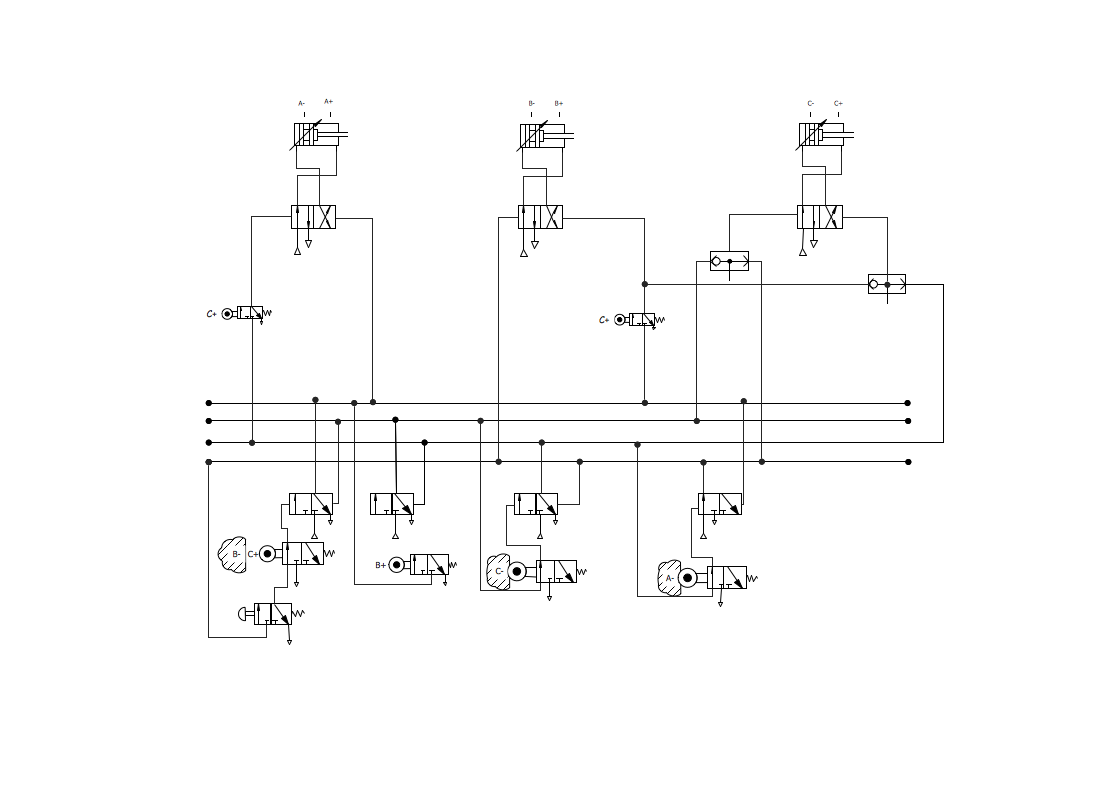
Making Mechanical Diagram
Physics Diagrams
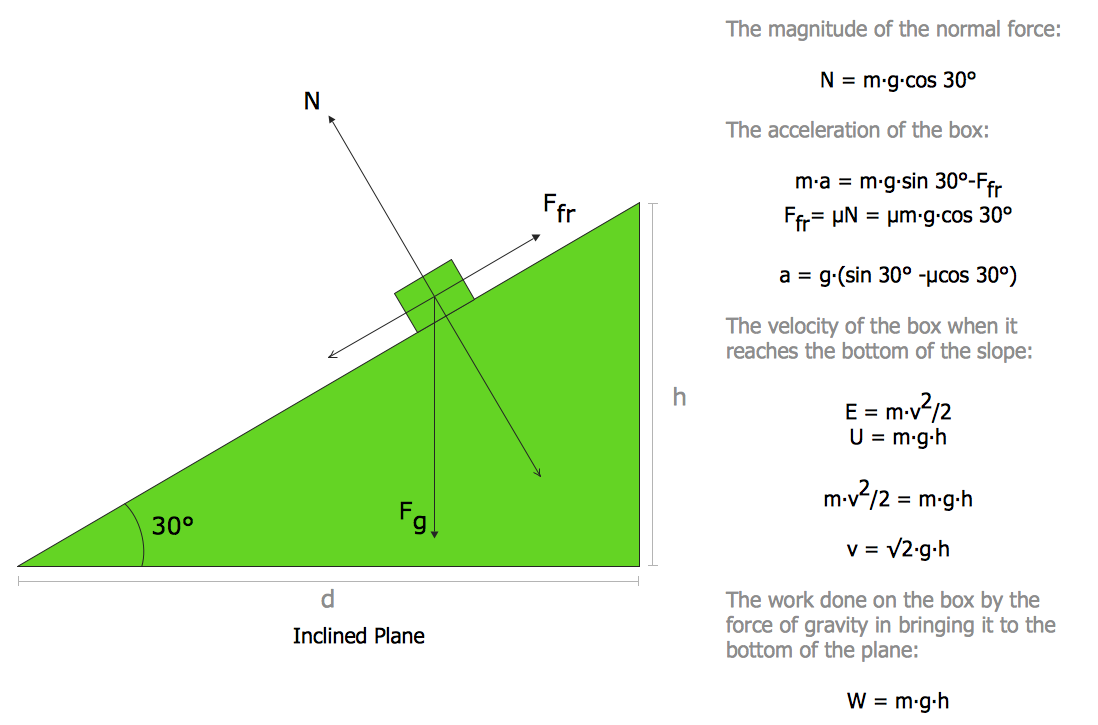
 Physics
Physics solution extends ConceptDraw DIAGRAM software with templates, samples and libraries of vector stencils for drawing the physical illustrations, diagrams and charts.
 Venn Diagrams
Venn Diagrams are actively used to illustrate simple set relationships in set theory and probability theory, logic and statistics, mathematics and computer science, linguistics, sociology, and marketing. Venn Diagrams are also often used to visually summarize the status and future viability of a project.
- Create Block Diagram | Block diagram - Document management ...
- Whta Are The Elelctronics Tools With Diagram
- Venn Diagrams | Electronic Component And Their Application Pdf
- Electronic Mechanical Symbol
- Engineering | Mechanical Engineering | Draw A Circuit Diagram Of ...
- Electrical Symbols — Analog and Digital Logic | Circuits and Logic ...
- Circuit Diagram Of An Electrical Circuit
- Design elements - IDEF3 process schematic symbols
- Mechanical Engineering | How to Create an Electrical Diagram ...
- Block Diagram | Functional Block Diagram | Process Flowchart | E ...
- ERD | Entity Relationship Diagrams, ERD Software for Mac and Win
- Flowchart | Basic Flowchart Symbols and Meaning
- Flowchart | Flowchart Design - Symbols, Shapes, Stencils and Icons
- Flowchart | Flow Chart Symbols
- Electrical | Electrical Drawing - Wiring and Circuits Schematics
- Flowchart | Common Flowchart Symbols
- Flowchart | Common Flowchart Symbols