 Entity-Relationship Diagram (ERD)
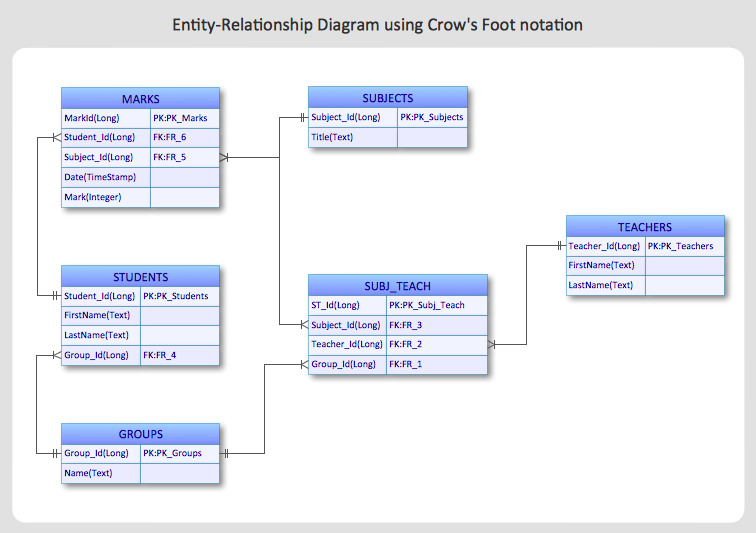
Entity-Relationship Diagram (ERD) solution extends ConceptDraw PRO software with templates, samples and libraries of vector stencils from drawing the ER-diagrams by Chen's and crow’s foot notations.
HelpDesk
How to Create an Entity-Relationship Diagram Using ConceptDraw Solution Park
An entity-relationship diagram (ERD)is used in a database modeling process. ERD diagram shows a graphical representation of objects or concepts within an information system and their relationships.The ability to describe a database using the Entity-Relationship model is delivered by the ConceptDraw ERD solution.Data modeling with ConceptDraw PRO
Data modelling will help you to study and analyze business processes in your organization for optimization and increase of effectiveness and production.Basic Flowchart Symbols and Meaning
Flowchart Symbols and Meaning - Provides a visual representation of basic flowchart symbols and their proposed use in professional workflow diagram, standard process flow diagram and communicating the structure of a well-developed web site, as well as their correlation in developing on-line instructional projects. See flowchart's symbols by specifics of process flow diagram symbols and workflow diagram symbols.
Process Flowchart
ConceptDraw is Professional business process mapping software for making process flow diagram, workflow diagram, general flowcharts and technical illustrations for business documents. It is includes rich examples, templates, process flowchart symbols. ConceptDraw flowchart maker allows you to easier create a process flowchart. Use a variety of drawing tools, smart connectors, flowchart symbols and shape libraries to create flowcharts of complex processes, process flow diagrams, procedures and information exchange.
Introduction to Cloud Computing Architecture
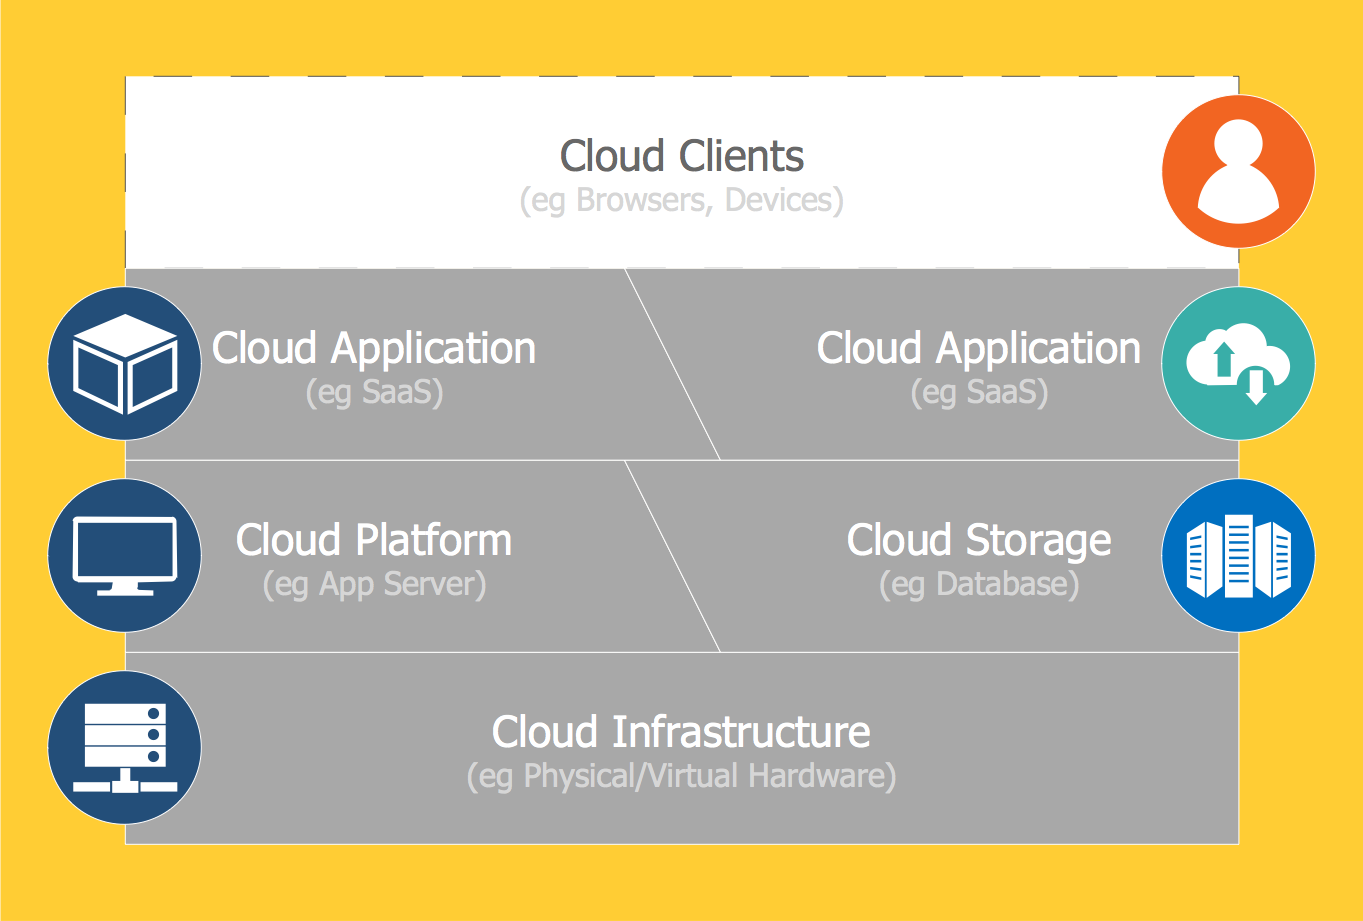
The best way to visualize the introduction to Cloud computing architecture is to create diagrams and schematics representing what is a cloud computing and how it works. For their design, we recommend to use a powerful ConceptDraw PRO diagramming and vector drawing software supplied with Cloud Computing Diagrams solution from the Computers and Network area of ConceptDraw Solution Park- Er Diagram For Education Database
- Entity-Relationship Diagram ( ERD ) | Education | ConceptDraw ...
- Education Database For Er Diagram
- Crow's foot ERD - Educational data base | Entity-Relationship ...
- How to Purchase ConceptDraw Products for Academic/Nonprofit ...
- Educational Diagram
- Entity-Relationship Diagram ( ERD ) | Fishbone Diagram | Education ...
- Entity-Relationship Diagram ( ERD ) | Education | Illustration ...
- Education System Er Diagram
- Entity-Relationship Diagram ( ERD ) | Education | Illustration | Swot ...
- Entity-Relationship Diagram ( ERD ) | School and Training Plans ...
- Entity-Relationship Diagram ( ERD ) | Mechanical Engineering ...
- Education System Sequence Diagram
- Entity-Relationship Diagram ( ERD ) | ConceptDraw Solution Park ...
- Entity-Relationship Diagram ( ERD ) | Education | Illustration | Swot ...
- Er Diagram Education Site
- Education | Entity-Relationship Diagram ( ERD ) | ConceptDraw ...
- ConceptDraw PRO Database Modeling Software | Entity ...
- Entity Relationship Diagram Symbols and Meaning ERD Symbols ...
- Detailed Entity Relationship Diagram Example For Management
- ERD | Entity Relationship Diagrams, ERD Software for Mac and Win
- Flowchart | Basic Flowchart Symbols and Meaning
- Flowchart | Flowchart Design - Symbols, Shapes, Stencils and Icons
- Flowchart | Flow Chart Symbols
- Electrical | Electrical Drawing - Wiring and Circuits Schematics
- Flowchart | Common Flowchart Symbols
- Flowchart | Common Flowchart Symbols


