The vector stencils library "Education charts" contains 12 graphs and charts: area chart, column chart, divided bar diagram, histogram, horizontal bar graph, line graph, pie chart, ring chart, scatter plot.
Use it to create your education infogram in the ConceptDraw PRO diagramming and vector drawing software.
The vector stencils library "Education charts" is included in the Education Infographics solution from the Business Infographics area of ConceptDraw Solution Park.
Use it to create your education infogram in the ConceptDraw PRO diagramming and vector drawing software.
The vector stencils library "Education charts" is included in the Education Infographics solution from the Business Infographics area of ConceptDraw Solution Park.
Area chart - serial

Column chart

Column chart - serial

Divided bar diagram

Frequency histogram

Horizontal bar chart

Horizontal bar chart - serial

Line chart - serial

Pie chart

Ring chart

Scatter plot

Scatter plot - serial

The vector stencils library "Education charts" contains 12 graphs and charts: area chart, column chart, divided bar diagram, histogram, horizontal bar graph, line graph, pie chart, ring chart, scatter plot.
Use it to create your educational infograms.
"A chart can take a large variety of forms, however there are common features that provide the chart with its ability to extract meaning from data.
Typically the data in a chart is represented graphically, since humans are generally able to infer meaning from pictures quicker than from text. Text is generally used only to annotate the data.
One of the more important uses of text in a graph is the title. A graph's title usually appears above the main graphic and provides a succinct description of what the data in the graph refers to.
Dimensions in the data are often displayed on axes. If a horizontal and a vertical axis are used, they are usually referred to as the x-axis and y-axis respectively. Each axis will have a scale, denoted by periodic graduations and usually accompanied by numerical or categorical indications. Each axis will typically also have a label displayed outside or beside it, briefly describing the dimension represented. If the scale is numerical, the label will often be suffixed with the unit of that scale in parentheses. ...
The data of a chart can appear in all manner of formats, and may include individual textual labels describing the datum associated with the indicated position in the chart. The data may appear as dots or shapes, connected or unconnected, and in any combination of colors and patterns. Inferences or points of interest can be overlaid directly on the graph to further aid information extraction.
When the data appearing in a chart contains multiple variables, the chart may include a legend (also known as a key). A legend contains a list of the variables appearing in the chart and an example of their appearance. This information allows the data from each variable to be identified in the chart." [Chart. Wikipedia]
The shapes example "Design elements - Education charts" was created using the ConceptDraw PRO diagramming and vector drawing software extended with the Education Infographics solition from the area "Business Infographics" in ConceptDraw Solution Park.
Graphs and charts

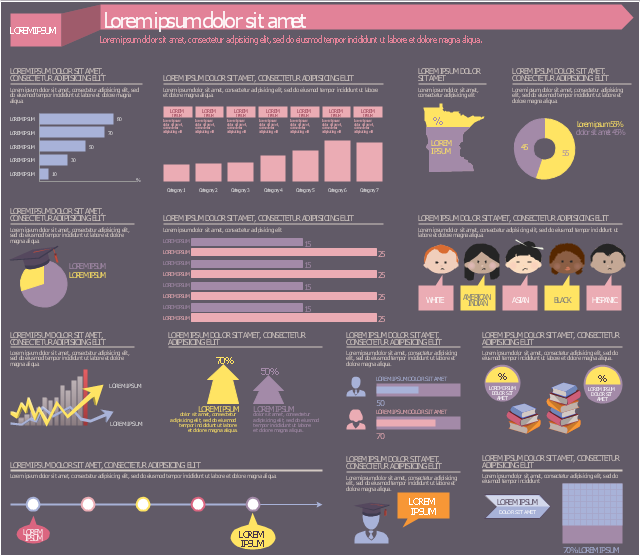
This education infographic template consists of design elements: callouts, horizontal bar chart, column chart (vertical bar graph), state map contour, donut chart indicator, pie chart indicator, horizontal bar chart indicators, arrow chart indicator, bullet indicators, square chart 10x10 indicator, pictograms.
Simply add text to design your own educational infogram.
The template "Education infogram 5" for the ConceptDraw PRO diagramming and vector drawing software is included in the Education Infographics solition from the area "Business Infographics" in ConceptDraw Solution Park.
Simply add text to design your own educational infogram.
The template "Education infogram 5" for the ConceptDraw PRO diagramming and vector drawing software is included in the Education Infographics solition from the area "Business Infographics" in ConceptDraw Solution Park.
Educational infogram template
Used Solutions
The vector stencils library "Education indicators" contains 12 graphic indicators: horizontal bar chart, pie chart, arrow chart, donut chart, square chart, stickman row pictograph, progress bar, bullet indicator, radial gauge, semi-radial gauge.
Use these visual indicators to design your educational infograms.
The shapes example "Design elements - Education indicators" was created using the ConceptDraw PRO diagramming and vector drawing software extended with the Education Infographics solition from the area "Business Infographics" in ConceptDraw Solution Park.
Graphic indicators
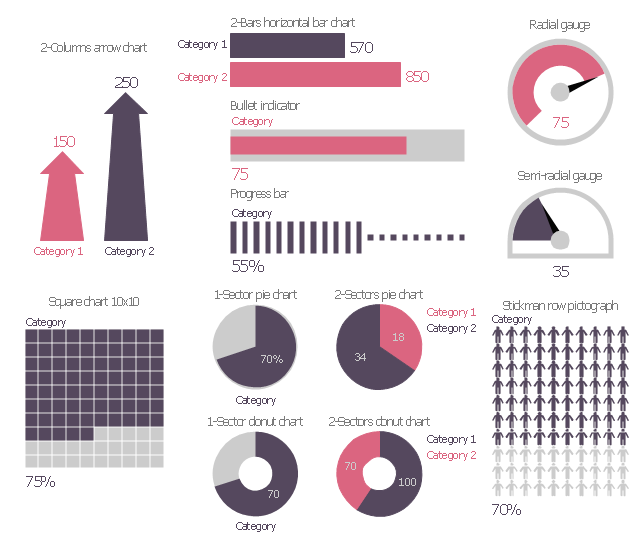
The vector stencils library "Education indicators" contains 12 graphic indicators.
Use these visual indicators to design your educational infogram.
The vector stencils library "Education indicators" is included in the Education Infographics solution from the Business Infographics area of ConceptDraw Solution Park.
Use these visual indicators to design your educational infogram.
The vector stencils library "Education indicators" is included in the Education Infographics solution from the Business Infographics area of ConceptDraw Solution Park.
1-Sector donut chart

2-Sectors donut chart

1-Sector pie chart

2-Sectors pie chart

2-Bars horizontal bar chart

2-Columns arrow chart
Bullet indicator

Progress bar

Radial gauge

Semi-radial gauge

Square chart 10x10 - filling from above

Stickman row pictograph

HelpDesk
How to Create Education Infographics

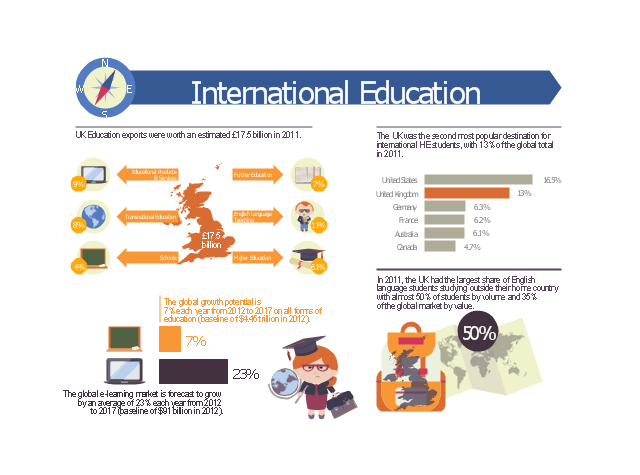
This example was designed on the base of infographic "International education" from the Great Britain Government website.
"UK Education exports were worth an estimated £17.5 billion in 2011.
The UK was the second most popular destination for international HE students, with 13% of the global total in 2011.
The global growth potential is 7% each year from 2012 to 2017 on all forms of education (baseline of $4.45 trillion in 2012).
In 2011, the UK had the largest share of English language students studying outside their home country with almost 50% of students by volume and 35% of the global market by value.
The global e-learning market is forecast to grow by an average of 23% each year from 2012 to 2017 (baseline of $91 billion in 2012)." [gov.uk/ government/ uploads/ system/ uploads/ attachment_ data/ file/ 225562/ international-education-industrial-strategy-infographics.pdf]
The educational infogram "International education" was created using the ConceptDraw PRO diagramming and vector drawing software extended with the Education Infographics solition from the area "Business Infographics" in ConceptDraw Solution Park.
Educational infogram
The vector stencils library "Education indicators" contains 12 graphic indicators.
Use these visual indicators to design your educational infogram.
The vector stencils library "Education indicators" is included in the Education Infographics solution from the Business Infographics area of ConceptDraw Solution Park.
Use these visual indicators to design your educational infogram.
The vector stencils library "Education indicators" is included in the Education Infographics solution from the Business Infographics area of ConceptDraw Solution Park.
1-Sector donut chart
2-Sectors donut chart
1-Sector pie chart
2-Sectors pie chart
2-Bars horizontal bar chart
2-Columns arrow chart
Bullet indicator
Progress bar
Radial gauge
Semi-radial gauge
Square chart 10x10 - filling from above
Stickman row pictograph
 Education Package
Education Package is a comprehensive set of multifarious graphical solutions from ConceptDraw Solution Park, collected together in help to ConceptDraw PRO users working in a field of science, education and training, which is aimed at improving the quality of education and helping to design with ease variety of interesting and colorful educational materials, diagrams, charts and maps. Use it to present the information and knowledge in an interesting, clear, structured and simple form to achieve a success in education and pedagogy, to maintain the interest of students and pupils throughout the whole learning process, at the lectures, lessons and even during independent work with additional materials, to contribute to better perception of scientific information by listeners during the conferences and reports.
Draw Company Structure with Organization Charting Software

Draw Company Structure Diagram - get the detailed information about the company structure and hierarchy - who execute what tasks and who is in charge at this company. This information shows the reasoning and success of business and is indispensable for investors and financial institutions.
Bar Diagrams for Problem Solving. Create space science bar charts with Bar Graphs Solution

Create bar graphs for visual solving your scientific problems and data comparison using the ConceptDraw PRO diagramming and vector drawing software extended with the Bar Graphs Solution from the Graphs and Charts area of ConceptDraw Solition Park.
Bar Diagrams for Problem Solving. Create manufacturing and economics bar charts with Bar Graphs Solution

 Bar Graphs
The Bar Graphs solution enhances ConceptDraw PRO v10 functionality with templates, numerous professional-looking samples, and a library of vector stencils for drawing different types of Bar Graphs, such as Simple Bar Graph, Double Bar Graph, Divided Bar Graph, Horizontal Bar Graph, Vertical Bar Graph, and Column Bar Chart.
- Education Bar Chart
- Bar Graphs | Design elements - Education charts | Design elements ...
- Area Charts | Education Package | Management Consultant | Bar ...
- Histogram Vs Bar Chart
- Bar Chart Software | Horizontal Flowchart | Design elements ...
- Education charts - Vector stencils library | Mathematical Diagrams ...
- Education charts - Vector stencils library | How to Draw the Different ...
- Bar Chart And Histogram
- Design elements - Education charts | Scatter Diagrams | Seven ...
- Education indicators - Vector stencils library | Waterfall Bar Chart ...
- Education Base Bar Chart
- How to Draw a Divided Bar Chart in ConceptDraw PRO | Divided ...
- Design elements - Education charts | Column Chart Software | Bar ...
- How to Draw a Histogram in ConceptDraw PRO | Education charts ...
- Education charts - Vector stencils library | Example Of Strata Chart
- Bar Chart Examples | Bar Chart Software | Chart Maker for ...
- Education The Chart Of Local Area
- Education charts - Vector stencils library | Design elements ...
- Design elements - Education charts | Seven Basic Tools of Quality ...
- Draw Company Structure with Organization Charting Software ...
- ERD | Entity Relationship Diagrams, ERD Software for Mac and Win
- Flowchart | Basic Flowchart Symbols and Meaning
- Flowchart | Flowchart Design - Symbols, Shapes, Stencils and Icons
- Flowchart | Flow Chart Symbols
- Electrical | Electrical Drawing - Wiring and Circuits Schematics
- Flowchart | Common Flowchart Symbols
- Flowchart | Common Flowchart Symbols