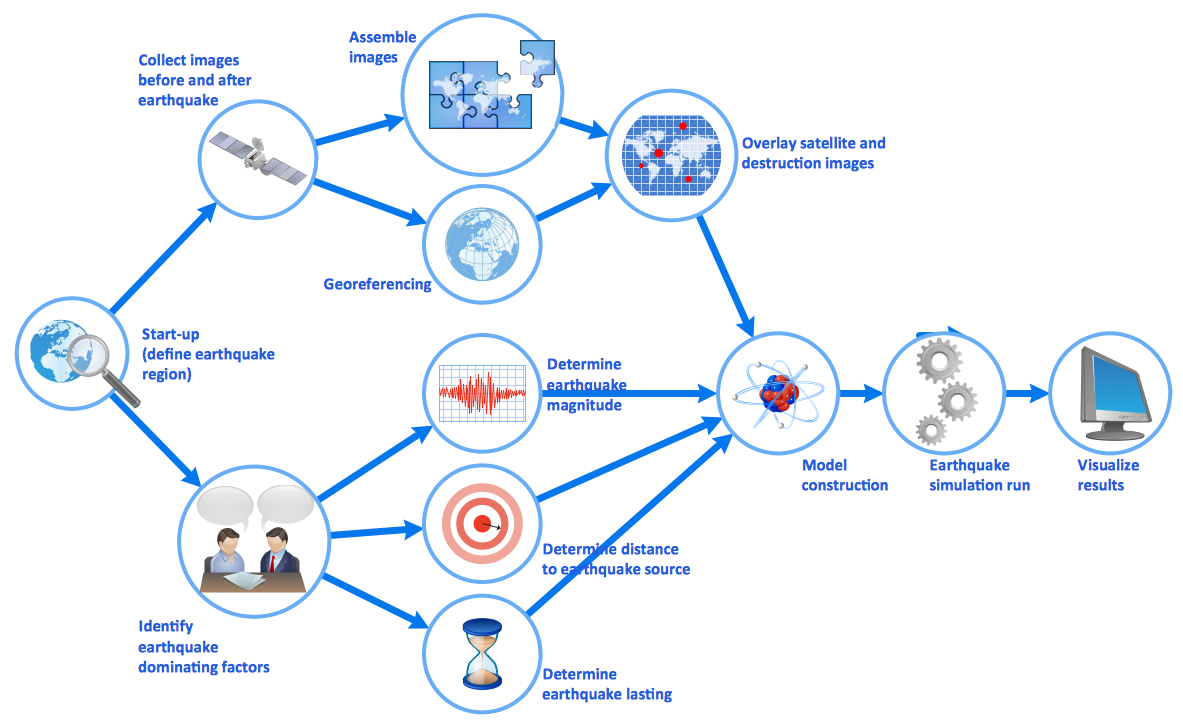
This work flow chart sample was redesigned from the picture "Simulation for earthquake disaster assessment" from the article "Simulation Workflows".
[iaas.uni-stuttgart.de/ forschung/ projects/ simtech/ sim-workflows.php]
" This simulation was developed to have an in depth understanding of the destructions and the decisions to be made in various phases of crisis management (Source: Mahdi Hashemi and Ali A. Alesheikh (2010). "Developing an agent based simulation model for earthquakes in the context of SDI." GSDI 12 World Conference. 19 – 22 October 2010. Singapour). The simulation process contains following major steps:
(1) All spatial information including satellite images (before and after the earthquake) and topographic/ cadastral maps of the area are mosaicked and georeferenced. The parts of the city that contain various levels of destructions are selected. Three types of features namely buildings, roads and recreational areas are classified and extracted from the satellite images.
(2) The governing factors of destructions are identified; a mathematical model that integrates the factors is constructed.
(3) The simulation is constructed for various parameter values (different earthquake strength, time elapses, etc.)" [iaas.uni-stuttgart.de/ forschung/ projects/ simtech/ sim-workflows.php]
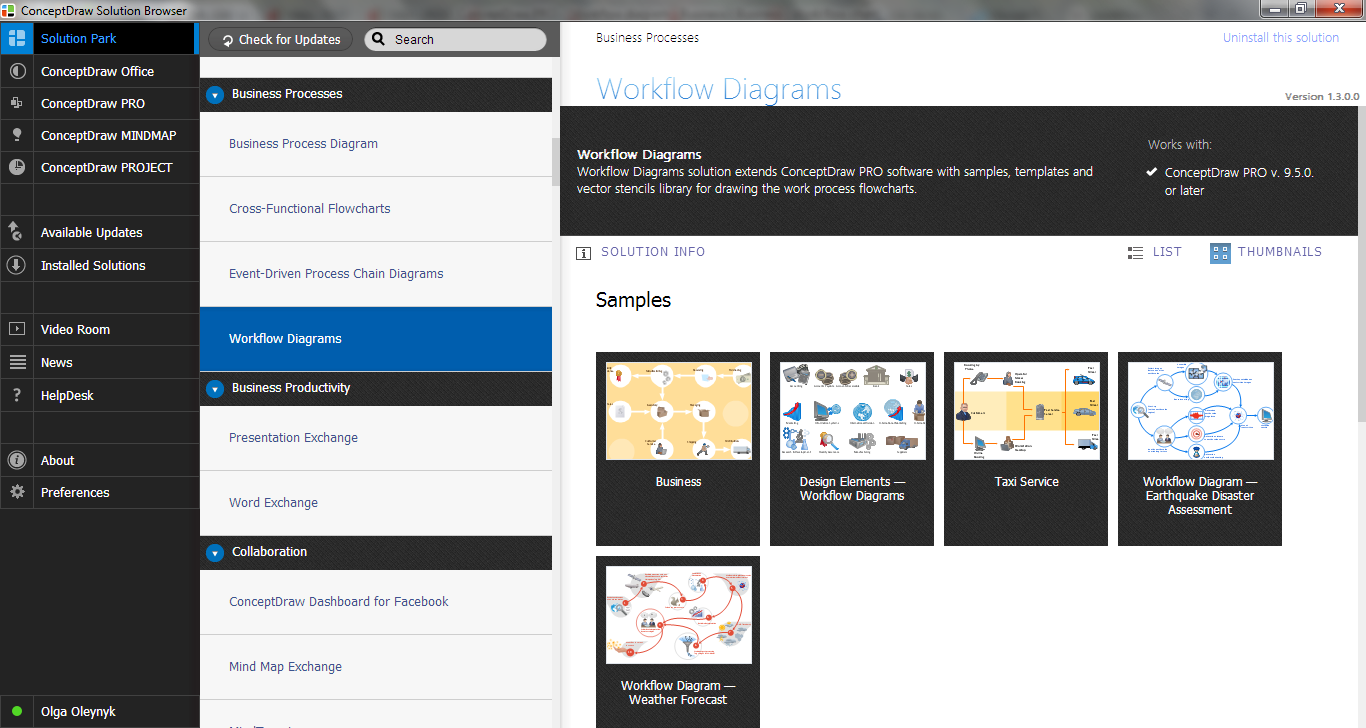
The example "Workflow diagram - Earthquake disaster assessment" was drawn using the ConceptDraw PRO diagramming and vector drawing software extended with the Workflow Diagrams solution from the Business Processes area of ConceptDraw Solution Park.
[iaas.uni-stuttgart.de/ forschung/ projects/ simtech/ sim-workflows.php]
" This simulation was developed to have an in depth understanding of the destructions and the decisions to be made in various phases of crisis management (Source: Mahdi Hashemi and Ali A. Alesheikh (2010). "Developing an agent based simulation model for earthquakes in the context of SDI." GSDI 12 World Conference. 19 – 22 October 2010. Singapour). The simulation process contains following major steps:
(1) All spatial information including satellite images (before and after the earthquake) and topographic/ cadastral maps of the area are mosaicked and georeferenced. The parts of the city that contain various levels of destructions are selected. Three types of features namely buildings, roads and recreational areas are classified and extracted from the satellite images.
(2) The governing factors of destructions are identified; a mathematical model that integrates the factors is constructed.
(3) The simulation is constructed for various parameter values (different earthquake strength, time elapses, etc.)" [iaas.uni-stuttgart.de/ forschung/ projects/ simtech/ sim-workflows.php]
The example "Workflow diagram - Earthquake disaster assessment" was drawn using the ConceptDraw PRO diagramming and vector drawing software extended with the Workflow Diagrams solution from the Business Processes area of ConceptDraw Solution Park.
Work flow chart

The vector stencils library "Weather" contains 17 weather clipart images for drawing illustrations on climate to show cloudiness, air temperature, precipitation, wind.
"Weather is the state of the atmosphere, to the degree that it is hot or cold, wet or dry, calm or stormy, clear or cloudy. Most weather phenomena occur in the troposphere, just below the stratosphere. Weather generally refers to day-to-day temperature and precipitation activity, whereas climate is the term for the average atmospheric conditions over longer periods of time. When used without qualification, "weather", is generally understood to mean the weather of Earth.
Weather is driven by air pressure (temperature and moisture) differences between one place and another. These pressure and temperature differences can occur due to the sun angle at any particular spot, which varies by latitude from the tropics. The strong temperature contrast between polar and tropical air gives rise to the jet stream. Weather systems in the mid-latitudes, such as extratropical cyclones, are caused by instabilities of the jet stream flow. Because the Earth's axis is tilted relative to its orbital plane, sunlight is incident at different angles at different times of the year. On Earth's surface, temperatures usually range ±40°C (−40°F to 100°F) annually. Over thousands of years, changes in Earth's orbit affect the amount and distribution of solar energy received by the Earth and influence long-term climate and global climate change." [Weather. Wikipedia]
The clip art example "Weather - Vector stencils library" was created using the ConceptDraw PRO diagramming and vector drawing software extended with the Nature solution from the Illustration area of ConceptDraw Solution Park.
www.conceptdraw.com/ solution-park/ illustrations-nature
Sunny

Cloudy

Overcast

Snow

Rain

Lightning

Hot

Warm

Frost

Mist

Strong wind

Flood

Tsunami

Dew

Hoar-frost

Earthquake

Snowflake

Emergency Plan


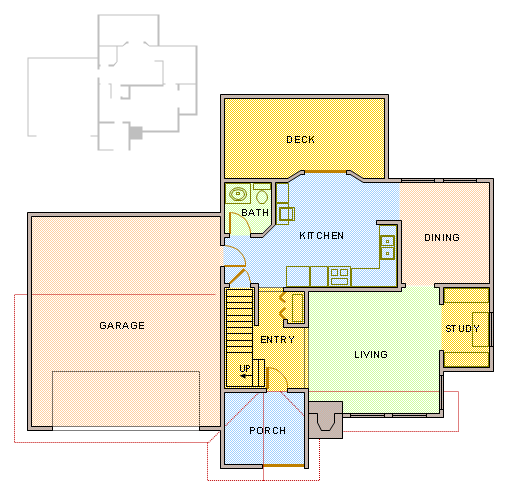
How To Create Home Plan with Examples

The vector stencils library "Weather" contains 17 weather clipart images for drawing illustrations on climate to show cloudiness, air temperature, precipitation, wind.
"Weather is the state of the atmosphere, to the degree that it is hot or cold, wet or dry, calm or stormy, clear or cloudy. Most weather phenomena occur in the troposphere, just below the stratosphere. Weather generally refers to day-to-day temperature and precipitation activity, whereas climate is the term for the average atmospheric conditions over longer periods of time. When used without qualification, "weather", is generally understood to mean the weather of Earth.
Weather is driven by air pressure (temperature and moisture) differences between one place and another. These pressure and temperature differences can occur due to the sun angle at any particular spot, which varies by latitude from the tropics. The strong temperature contrast between polar and tropical air gives rise to the jet stream. Weather systems in the mid-latitudes, such as extratropical cyclones, are caused by instabilities of the jet stream flow. Because the Earth's axis is tilted relative to its orbital plane, sunlight is incident at different angles at different times of the year. On Earth's surface, temperatures usually range ±40°C (−40°F to 100°F) annually. Over thousands of years, changes in Earth's orbit affect the amount and distribution of solar energy received by the Earth and influence long-term climate and global climate change." [Weather. Wikipedia]
The clip art example "Weather - Vector stencils library" was created using the ConceptDraw PRO diagramming and vector drawing software extended with the Nature solution from the Illustration area of ConceptDraw Solution Park.
www.conceptdraw.com/ solution-park/ illustrations-nature
"Weather is the state of the atmosphere, to the degree that it is hot or cold, wet or dry, calm or stormy, clear or cloudy. Most weather phenomena occur in the troposphere, just below the stratosphere. Weather generally refers to day-to-day temperature and precipitation activity, whereas climate is the term for the average atmospheric conditions over longer periods of time. When used without qualification, "weather", is generally understood to mean the weather of Earth.
Weather is driven by air pressure (temperature and moisture) differences between one place and another. These pressure and temperature differences can occur due to the sun angle at any particular spot, which varies by latitude from the tropics. The strong temperature contrast between polar and tropical air gives rise to the jet stream. Weather systems in the mid-latitudes, such as extratropical cyclones, are caused by instabilities of the jet stream flow. Because the Earth's axis is tilted relative to its orbital plane, sunlight is incident at different angles at different times of the year. On Earth's surface, temperatures usually range ±40°C (−40°F to 100°F) annually. Over thousands of years, changes in Earth's orbit affect the amount and distribution of solar energy received by the Earth and influence long-term climate and global climate change." [Weather. Wikipedia]
The clip art example "Weather - Vector stencils library" was created using the ConceptDraw PRO diagramming and vector drawing software extended with the Nature solution from the Illustration area of ConceptDraw Solution Park.
www.conceptdraw.com/ solution-park/ illustrations-nature
Sunny
Cloudy
Overcast
Snow
Rain
Lightning
Hot
Warm
Frost
Mist
Strong wind
Flood
Tsunami
Dew
Hoar-frost
Earthquake
Snowflake
Diagramming Software for Design UML Object Diagrams
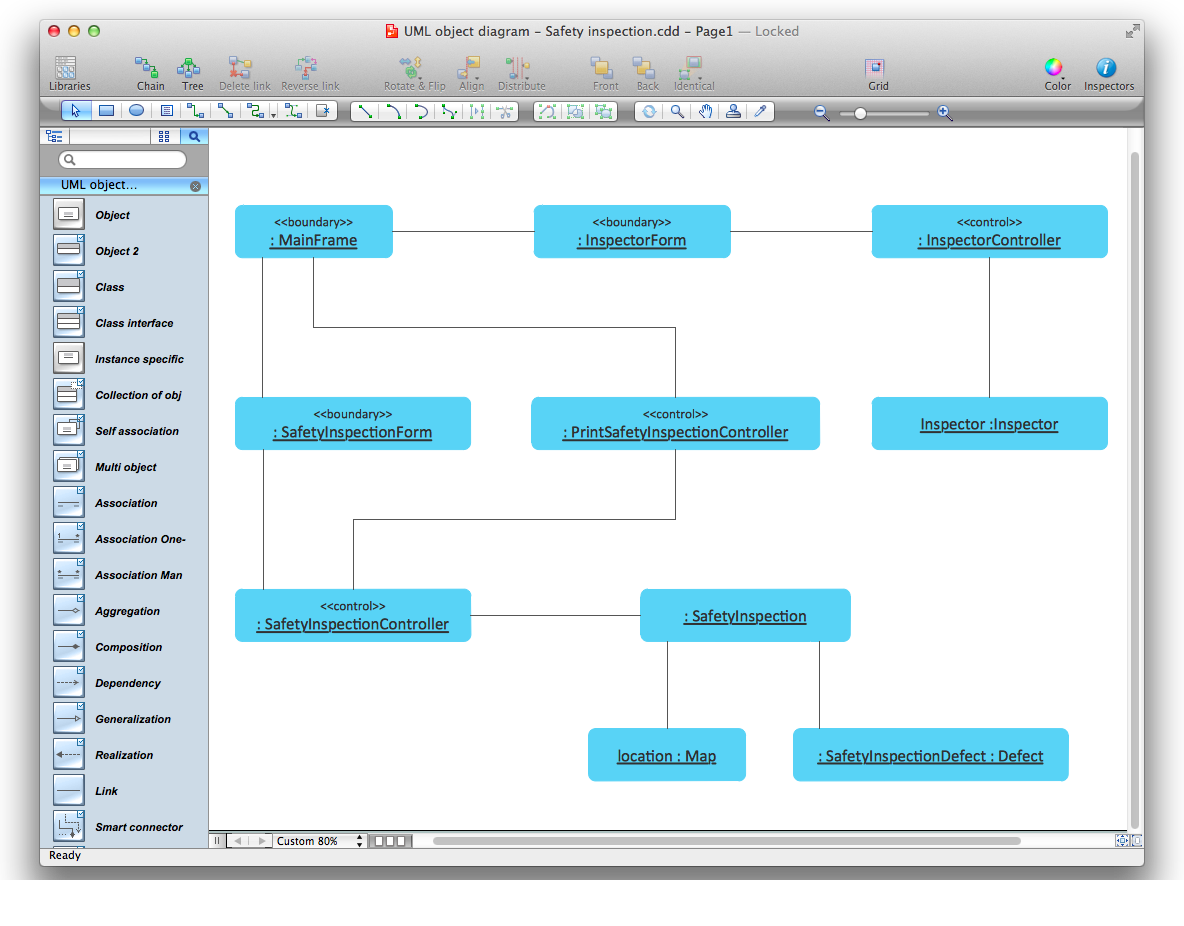
ConceptDraw Rapid UML solution delivers libraries contain pre-designed objects fit UML notation, and ready to draw professional UML Object Diagram.

Workflow Examples
The vector stencils library Weather contains 17 symbols of meteorological conditions: sunny, cloudy, overcast, snow, rain, lighting, hot, warm, cold, mist, strong wind, flood, tsunami, dew, hoarfrost, earthquake, snowflake.
Use the design elements library Weather to draw illustrations, calendars, maps and infographics with weather phenomena clipart using the ConceptDraw PRO diagramming and vector graphics software.
"Weather is the state of the atmosphere, to the degree that it is hot or cold, wet or dry, calm or stormy, clear or cloudy. Most weather phenomena occur in the troposphere, just below the stratosphere. Weather generally refers to day-to-day temperature and precipitation activity, whereas climate is the term for the average atmospheric conditions over longer periods of time. When used without qualification, "weather" is understood to mean the weather of Earth." [Weather. Wikipedia]
This example of weather clipart is included in the Nature solution from the Illustration area of ConceptDraw Solution Park.
Vector clip art

Work Flow Diagram
Any flow diagram can be sometimes seen as a counterpart of some flowchart being created with the help of the ConceptDraw DIAGRAM diagramming and drawing software as well as the Workflow Diagrams solution taken from the ConceptDraw STORE application.
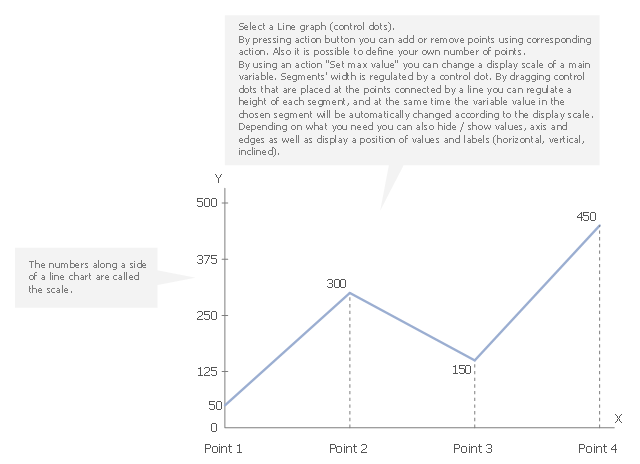
This line graph templates shows the number of tourists visiting the resort town for six months. Use it to design your time series line charts in ConceptDraw PRO diagramming and vector drawing software.
"A time series is a sequence of data points, measured typically at successive points in time spaced at uniform time intervals. ... Time series are very frequently plotted via line charts. Time series are used in statistics, signal processing, pattern recognition, econometrics, mathematical finance, weather forecasting, earthquake prediction, electroencephalography, control engineering, astronomy, and communications engineering. Time series analysis comprises methods for analyzing time series data in order to extract meaningful statistics and other characteristics of the data. Time series forecasting is the use of a model to predict future values based on previously observed values. While regression analysis is often employed in such a way as to test theories that the current values of one or more independent time series affect the current value of another time series, this type of analysis of time series is not called "time series analysis", which focuses on comparing values of time series at different points in time. Time series data have a natural temporal ordering." [Time series. Wikipedia]
The chart template "Line graph" is included in the Basic Line Graphs solution from the Graphs and Charts area of ConceptDraw Solution Park.
Chart template
How To use Architect Software
The vector stencils library "Weather" contains 17 weather clipart images for drawing illustrations on climate to show cloudiness, air temperature, precipitation, wind.
"Weather is the state of the atmosphere, to the degree that it is hot or cold, wet or dry, calm or stormy, clear or cloudy. Most weather phenomena occur in the troposphere, just below the stratosphere. Weather generally refers to day-to-day temperature and precipitation activity, whereas climate is the term for the average atmospheric conditions over longer periods of time. When used without qualification, "weather", is generally understood to mean the weather of Earth.
Weather is driven by air pressure (temperature and moisture) differences between one place and another. These pressure and temperature differences can occur due to the sun angle at any particular spot, which varies by latitude from the tropics. The strong temperature contrast between polar and tropical air gives rise to the jet stream. Weather systems in the mid-latitudes, such as extratropical cyclones, are caused by instabilities of the jet stream flow. Because the Earth's axis is tilted relative to its orbital plane, sunlight is incident at different angles at different times of the year. On Earth's surface, temperatures usually range ±40°C (−40°F to 100°F) annually. Over thousands of years, changes in Earth's orbit affect the amount and distribution of solar energy received by the Earth and influence long-term climate and global climate change." [Weather. Wikipedia]
The clip art example "Weather - Vector stencils library" was created using the ConceptDraw PRO diagramming and vector drawing software extended with the Nature solution from the Illustration area of ConceptDraw Solution Park.
www.conceptdraw.com/ solution-park/ illustrations-nature
"Weather is the state of the atmosphere, to the degree that it is hot or cold, wet or dry, calm or stormy, clear or cloudy. Most weather phenomena occur in the troposphere, just below the stratosphere. Weather generally refers to day-to-day temperature and precipitation activity, whereas climate is the term for the average atmospheric conditions over longer periods of time. When used without qualification, "weather", is generally understood to mean the weather of Earth.
Weather is driven by air pressure (temperature and moisture) differences between one place and another. These pressure and temperature differences can occur due to the sun angle at any particular spot, which varies by latitude from the tropics. The strong temperature contrast between polar and tropical air gives rise to the jet stream. Weather systems in the mid-latitudes, such as extratropical cyclones, are caused by instabilities of the jet stream flow. Because the Earth's axis is tilted relative to its orbital plane, sunlight is incident at different angles at different times of the year. On Earth's surface, temperatures usually range ±40°C (−40°F to 100°F) annually. Over thousands of years, changes in Earth's orbit affect the amount and distribution of solar energy received by the Earth and influence long-term climate and global climate change." [Weather. Wikipedia]
The clip art example "Weather - Vector stencils library" was created using the ConceptDraw PRO diagramming and vector drawing software extended with the Nature solution from the Illustration area of ConceptDraw Solution Park.
www.conceptdraw.com/ solution-park/ illustrations-nature
Sunny
Cloudy
Overcast
Snow
Rain
Lightning
Hot
Warm
Frost
Mist
Strong wind
Flood
Tsunami
Dew
Hoar-frost
Earthquake
Snowflake
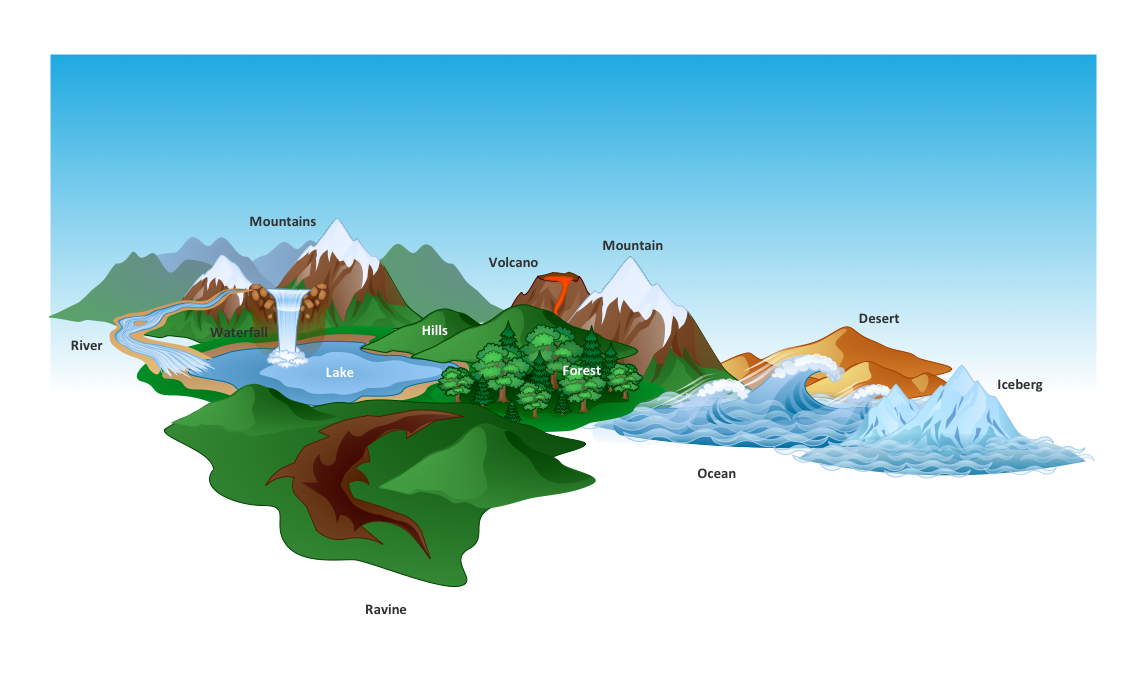
Beautiful Nature Scene: Drawing
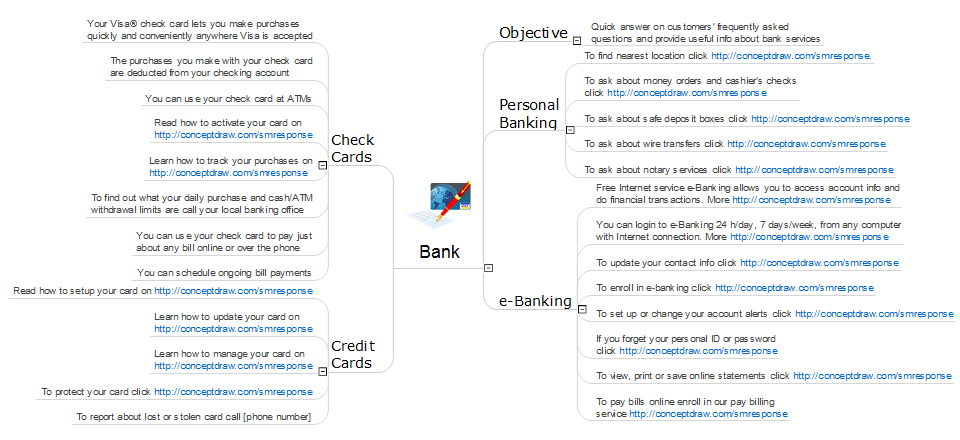
What Is an Action Mind Map
Geo Map - Asia - Philippines

Use the Continent Maps solution and Philippines library to draw thematic maps, geospatial infographics and vector illustrations. This solution to help visualize the business and thematic information connected with geographic areas, locations or customs; for your business documents, presentations and websites.
- Earthquake Clipart Png
- Earthquake Png
- Earthquake Effect Png
- Png Earthquake Effect
- Hoarfrost Png
- Lightning Weather Png
- Png Vector Rain
- Snowflake Png Vector
- Snowflake Vector Png
- Flood Clip Art Png
- Rain Png Clipart
- Flood Vector Png
- Cloud Rain Vector Png
- Geo Map - Europe - Bosnia and Herzegovina | Weather - Vector ...
- Warm Png
- Earth Illustration Png
- Yellow Stream Png
- Puzzle Png
- Sim Vector Png
- Sim In Circle Png
- ERD | Entity Relationship Diagrams, ERD Software for Mac and Win
- Flowchart | Basic Flowchart Symbols and Meaning
- Flowchart | Flowchart Design - Symbols, Shapes, Stencils and Icons
- Flowchart | Flow Chart Symbols
- Electrical | Electrical Drawing - Wiring and Circuits Schematics
- Flowchart | Common Flowchart Symbols
- Flowchart | Common Flowchart Symbols