Bar Diagrams for Problem Solving. Create space science bar charts with Bar Graphs Solution

Create bar graphs for visual solving your scientific problems and data comparison using the ConceptDraw DIAGRAM diagramming and vector drawing software extended with the Bar Graphs Solution from the Graphs and Charts area of ConceptDraw Solition Park.
This pie chart sample shows the atmosphere air composition. It was designed on the base of the Wikimedia Commons file: Air composition pie chart.JPG.
[commons.wikimedia.org/ wiki/ File:Air_ composition_ pie_ chart.JPG]
This file is licensed under the Creative Commons Attribution-Share Alike 3.0 Unported license. [creativecommons.org/ licenses/ by-sa/ 3.0/ deed.en]
"The atmosphere of Earth is a layer of gases surrounding the planet Earth that is retained by Earth's gravity. The atmosphere protects life on Earth by absorbing ultraviolet solar radiation, warming the surface through heat retention (greenhouse effect), and reducing temperature extremes between day and night (the diurnal temperature variation).
The common name given to the atmospheric gases used in breathing and photosynthesis is air. By volume, dry air contains 78.09% nitrogen, 20.95% oxygen, 0.93% argon, 0.039% carbon dioxide, and small amounts of other gases. Air also contains a variable amount of water vapor, on average around 1%. Although air content and atmospheric pressure vary at different layers, air suitable for the survival of terrestrial plants and terrestrial animals currently is only known to be found in Earth's troposphere and artificial atmospheres." [Atmosphere of Earth. Wikipedia]
The pie chart example "Atmosphere air composition" was created using the ConceptDraw PRO diagramming and vector drawing software extended with the Pie Charts solution of the Graphs and Charts area in ConceptDraw Solution Park.
Pie chart

Basic Diagramming Flowchart Software

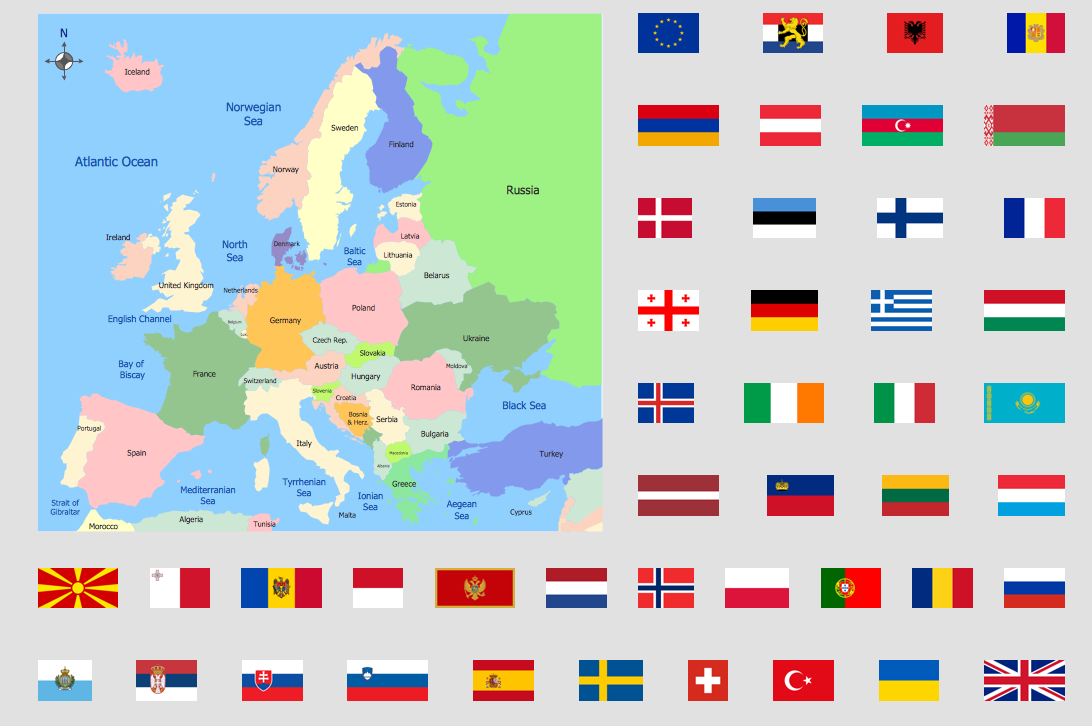
World Continents Map
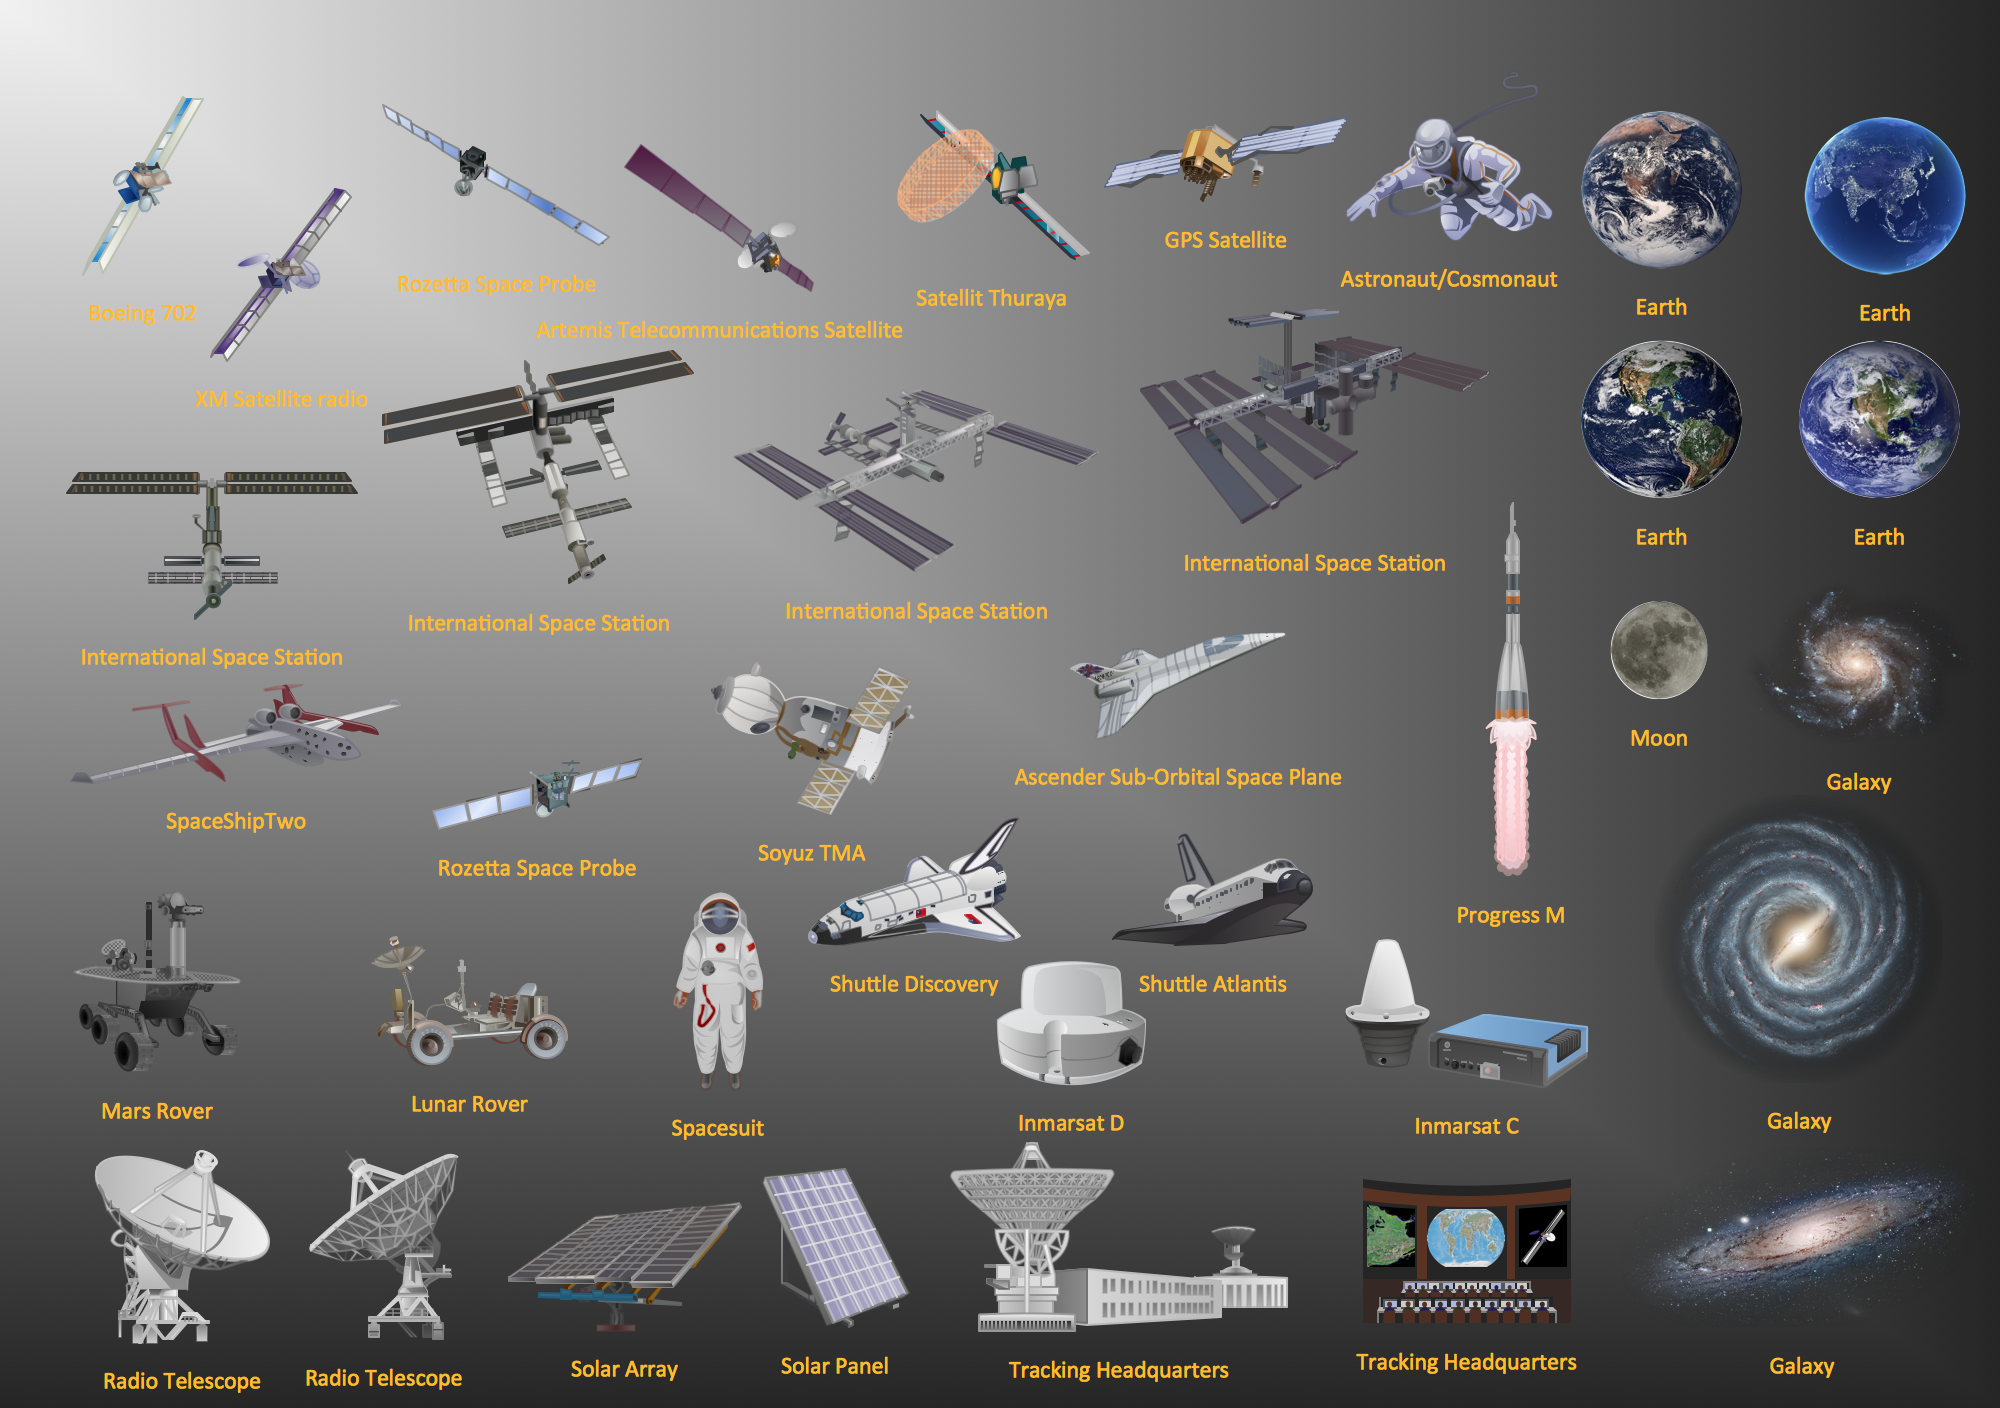
Aerospace - Design Elements
This DFD sample was created on the base of the figure from the NASA website. [asd-www.larc.nasa.gov/ ATBD/ DFD.html]
"Clouds and the Earth's Radiant Energy System (CERES).
EOS-Terra: Understanding Earth's Clouds and Climate.
The Clouds and the Earth's Radiant Energy System (CERES) instrument is one of several that will be flown aboard the Earth Observing System's Terra spacecraft, scheduled for launch in late1999. The data from the CERES instrument will be used to study the energy exchanged between the Sun; the Earth's atmosphere, surface and clouds; and outer space.
The CERES EOS-Terra instrument will be the second CERES instrument in Earth orbit. The first CERES instrument is currently orbiting the Earth aboard the Tropical Rainfall Measuring Mission observatory, which was launched in November 1997. Early results of the TRMM mission show that the first CERES has provided better measurement capabilities than any previous satellite instrument of its kind.
What CERES Will Measure.
CERES will measure the energy at the top of the atmosphere, as well as estimate energy levels in the atmosphere and at the Earth's surface. Using information from very high resolution cloud imaging instruments on the same spacecraft, CERES also will determine cloud properties, including cloud amount, altitude, thickness, and the size of the cloud particles. All of these measurements are critical for advancing our understanding of the Earth's total climate system and further improving climate prediction models.
The CERES instrument is based on NASA Langley's highly successful Earth Radiation Budget Experiment (ERBE) which used three satellites to provide global energy budget measurements from 1984 to 1990." [nasa.gov/ centers/ langley/ news/ factsheets/ CERES.html]
The DFD example "CERES data flow diagram" was created using the ConceptDraw PRO diagramming and vector drawing software extended with the Data Flow Diagrams solution from the Software Development area of ConceptDraw Solution Park.
DFD

Scientific Symbols Chart

Mathematics Solution from the Science and Education area of ConceptDraw Solution Park includes a few shape libraries of plane, solid geometric figures, trigonometrical functions and greek letters to help you create different professional looking mathematic illustrations for science and education.
Simple Drawing Applications for Mac

Biology Drawing Software

Sketching Software

Using Fishbone Diagrams for Problem Solving

Using Fishbone Diagrams for Problem Solving is a productive and illustrative tool to identify the most important factors causing the trouble. ConceptDraw DIAGRAM extended with Fishbone Diagrams solution from the Management area of ConceptDraw Solution Park is a powerful tool for problem solving with Fishbone Ishikawa diagram graphic method.
Infographic Maker

Chemistry Drawings

that can be then successfully used in the field of science and education, on various conferences, and so on.
Material Requisition Flowchart. Flowchart Examples

The flowchart example shows the material requisition business process.
- Percentage Pie Chart . Pie Chart Examples | Atmosphere air ...
- Drawing a Nature Scene | Nature | Water cycle diagram | Earth ...
- Flow Chart For Earth Movement
- Drawing a Nature Scene | Nature | Flow Chart Of Earth Movement
- Water cycle diagram | Drawing a Nature Scene | Nature | Digram ...
- Simplified Diagram Of The Earth
- Diagram Of The Flow Chart Of Earth Movements
- Beautiful Nature Scene: Drawing | Flow Chart On Save The Earth
- Tree For The Earth Diagram
- Earth Movement Flow Chart
- Pie Diagram On Percentage Of Water Available On Earth
- Atmosphere air composition | Percentage Pie Chart . Pie Chart ...
- How to Draw a Pie Chart Using ConceptDraw PRO | Pie Chart ...
- Earth System Example Diagram
- Basic Diagramming Flowchart Software | Scientific Symbols Chart ...
- Process Flowchart | A Chàrt About The Earth Movement
- Simple Flow Chart | How to Draw Physics Diagrams in ConceptDraw ...
- CERES data flow diagram | Process Flowchart | Bar Diagrams for ...
- Draw A Flow Chart Of Earth Movement
- Make Flow Chart Of Water On The Earth
- ERD | Entity Relationship Diagrams, ERD Software for Mac and Win
- Flowchart | Basic Flowchart Symbols and Meaning
- Flowchart | Flowchart Design - Symbols, Shapes, Stencils and Icons
- Flowchart | Flow Chart Symbols
- Electrical | Electrical Drawing - Wiring and Circuits Schematics
- Flowchart | Common Flowchart Symbols
- Flowchart | Common Flowchart Symbols