This site uses cookies. By continuing to browse the ConceptDraw site you are agreeing to our Use of Site Cookies.

dashboard software, social community dashboard, dashboard facebook ConceptDraw Dashboard for Facebook

dashboard software, social community dashboard, dashboard facebook
ConceptDraw Dashboard for Facebook solution extends ConceptDraw DIAGRAM software with a dynamically updated visual dashboard, which shows lifetime total likes, daily friends of fans, and daily page views, information you can receive from Facebook Insights.
HelpDesk

How to Use ConceptDraw Sales Dashboard Solution

An interactive visual dashboard is a valuable tool for any sales team. Sales dashboard allows you to view and monitor sales indicators that are important for manager and sales staff. It helps to use timely and reliable information to improve the quality of sales performance and increase sales revenues. ConceptDraw Sales Dashboard solution is a tool for both: sales manager and sales team. It provides the visualization of key performance indicators that are critical to the entire sales organization. The custom sales dashboard displays real-time information on sales performance KPIs with the help of intuitive and easy-to-understand diagrams and charts. Sales Dashboard helps the entire team see where they are, and what needs to be done. With ConceptDraw DIAGRAM you can easily create a visual Sales Dashboard using Live Objects Technology.

Visualize Sales Data Using Sample Data

ConceptDraw DIAGRAM software extended with the Sales Dashboard solution allows you visualize sales data using sample data delivered with the solution to choose visual indicators you need, and then connect these indicators to your real data.

Data Visualization Solutions

Data visualization solutions help you to see how your business can improve. Visualizing sales data using ConceptDraw Sales Dashboard gives you a bird's-eye view of the sale process.

Visualizing Sales Data

Visualizing sales data is a good start point for analysing and optimizing sales process. With ConceptDraw Sales Dashboard solution you are able to connect your sales data to visual indicators, and then see how your sales work.

Business Graphics Software

ConceptDraw DIAGRAM is a business graphics software that allows you improve your business using Sales Performance Dashboard helps you analyze your data more efficiently.

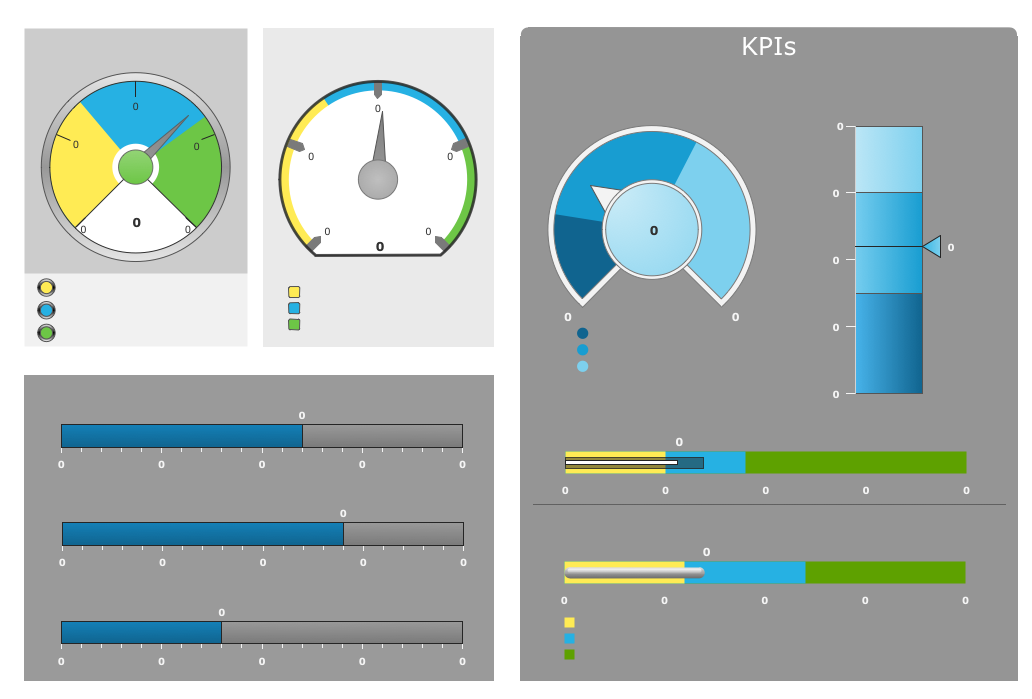
Sales Dashboard - insight about potential opportunities and key sales operations

ConceptDraw Sales Dashboard gives you a clear insight about potential opportunities and key sales operations. Analysing sales KPI is a proven way to see how your business can improve.

Sales Dashboards for Your Company

ConceptDraw DIAGRAM software extended with the Sales Dashboard solution allows you produce sales dashboards for your company easily. You can start from samples and templates delivered with the solution and then modify them to get a dashboard that suites your specific needs.

Dashboard

ConceptDraw DIAGRAM extended with Sales Dashboard solution from the Marketing area of ConceptDraw Solution Park is a perfect software for creating the live dashboard for the business data and progress visualization.