 Accounting Flowcharts
Accounting Flowcharts solution extends ConceptDraw DIAGRAM software with templates, samples and library of vector stencils for drawing the accounting flow charts.
 ConceptDraw Solution Park
ConceptDraw Solution Park collects graphic extensions, examples and learning materials
Network Diagram Examples
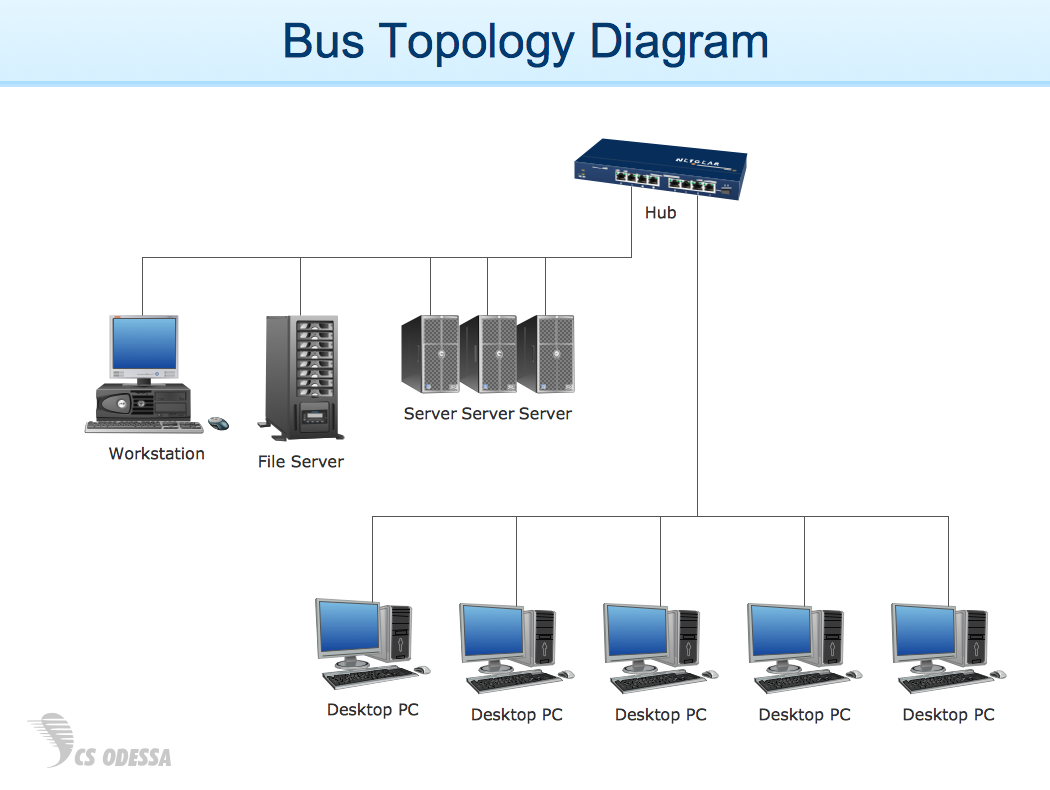
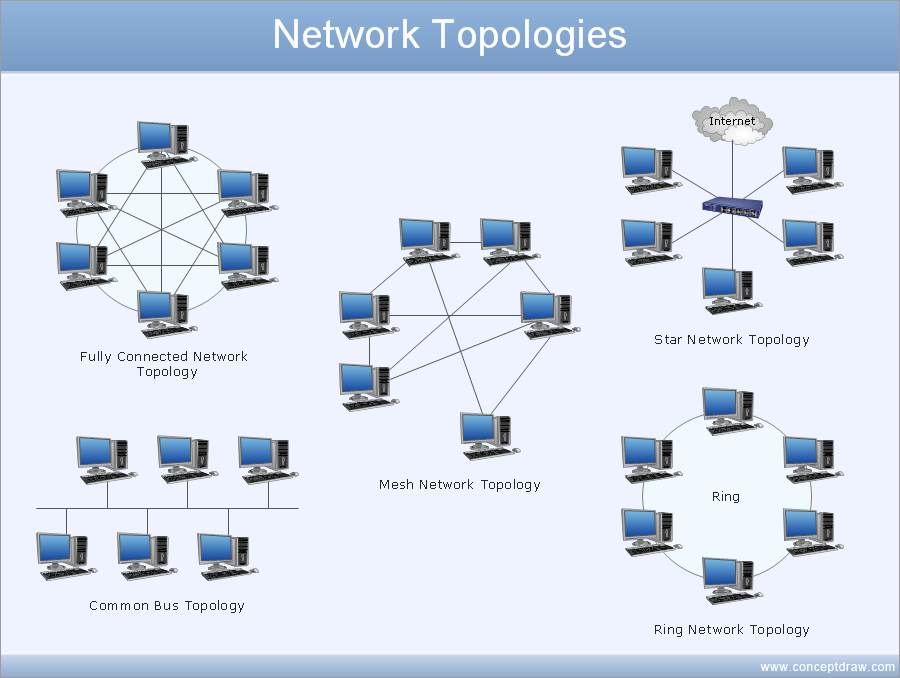
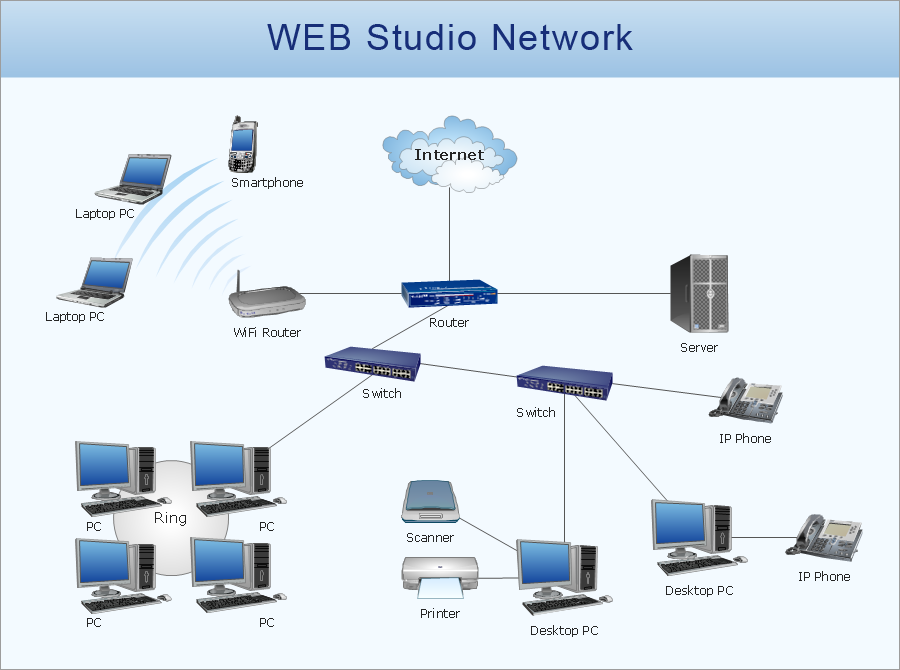
ConceptDraw DIAGRAM diagramming software includes huge collection of network diagrams examples, computer and network templates, design objects and stencils.
 Entity-Relationship Diagram (ERD)
Entity-Relationship Diagram (ERD) solution extends ConceptDraw DIAGRAM software with templates, samples and libraries of vector stencils from drawing the ER-diagrams by Chen's and crow’s foot notations.
Draw Network Diagram based on Templates and Examples
ConceptDraw is rapid and powerful network diagram drawing software with rich examples, templates, design objects and stencils.
 Value Stream Mapping
Value stream mapping solution extends ConceptDraw DIAGRAM software with templates, samples and vector stencils for drawing the Value Stream Maps (VSM) in lean manufacturing practice.
 Rapid UML
Rapid UML solution extends ConceptDraw DIAGRAM software with templates, samples and libraries of vector stencils for quick drawing the UML diagrams using Rapid Draw technology.
 Spatial Infographics
Spatial infographics solution extends ConceptDraw DIAGRAM software with infographic samples, map templates and vector stencils libraries with design elements for drawing spatial information graphics.
 Fishbone Diagram
Fishbone Diagrams solution extends ConceptDraw DIAGRAM software with templates, samples and library of vector stencils for drawing the Ishikawa diagrams for cause and effect analysis.
Network Diagram Software
ConceptDraw DIAGRAM is the best network diagram software that allows to draw Logical Network Diagram, Network Communication Plan, Network Floor Plan Layout, Active Directory Diagram, Cisco Network Diagram, LAN and WAN Diagram.Our network drawing software has numerous network design diagram examples and templates:
GPRS Network Scheme,
GPS Operation Diagram,
Hybrid Network Diagram,
Mobile Satellite Communication Network,
Mobile TV Network Diagram,
Web-based Network Diagram,
Wireless Broadband Network Diagram,
Wireless Router Network Diagram.
You can use the more than 2 000 pre-designed stencils for making custom network diagrams.

 Seven Management and Planning Tools
Seven Management and Planning Tools solution extends ConceptDraw DIAGRAM and ConceptDraw MINDMAP with features, templates, samples and libraries of vector stencils for drawing management mind maps and diagrams.
 Event-driven Process Chain Diagrams
Event-Driven Process Chain Diagrams solution extends ConceptDraw DIAGRAM functionality with event driven process chain templates, samples of EPC engineering and modeling the business processes, and a vector shape library for drawing the EPC diagrams and EPC flowcharts of any complexity. It is one of EPC IT solutions that assist the marketing experts, business specialists, engineers, educators and researchers in resources planning and improving the business processes using the EPC flowchart or EPC diagram. Use the EPC solutions tools to construct the chain of events and functions, to illustrate the structure of a business process control flow, to describe people and tasks for execution the business processes, to identify the inefficient businesses processes and measures required to make them efficient.
- The Best Drawing Program for Mac | Pyramid Chart Examples ...
- Network Diagram Examples | Network Drawing Software | Network ...
- Network Drawing Software | Network Diagram Software | Illustrate ...
- SWOT Analysis Solution - Strategy Tools | Swot Analysis Examples ...
- Network Diagram Examples
- Wireless Network Drawing | Wireless Network with ConceptDraw ...
- UML Tool & UML Diagram Examples | ConceptDraw Solution Park ...
- Entity-Relationship Diagram (ERD) | ConceptDraw Solution Park ...
- How To use Building Plan Examples | Building Drawing Software for ...
- Entity-Relationship Diagram (ERD)
- Rapid UML | UML Tool & UML Diagram Examples | Sample for UML |
- Network Diagram Examples | Basic Diagramming | Building Drawing ...
- Building Drawing Design Element: Piping Plan ... - Conceptdraw.com
- UML Tool & UML Diagram Examples
- Computer and Networks | Network Diagram Examples | Computer ...
- The Best Drawing Program for Mac | Scatter Chart Examples | Line ...
- Swot Analysis Examples | SWOT Analysis | SWOT analysis matrix ...
- Wireless Networks | Wireless Network Diagram Examples | Wireless ...
- SWOT Analysis Solution - Strategy Tools | Pyramid Chart Examples | |
- UML Tool & UML Diagram Examples | Rapid UML | UML Business ...
- ERD | Entity Relationship Diagrams, ERD Software for Mac and Win
- Flowchart | Basic Flowchart Symbols and Meaning
- Flowchart | Flowchart Design - Symbols, Shapes, Stencils and Icons
- Flowchart | Flow Chart Symbols
- Electrical | Electrical Drawing - Wiring and Circuits Schematics
- Flowchart | Common Flowchart Symbols
- Flowchart | Common Flowchart Symbols


