Line Chart Template for Word

This sample shows the Line Chart of annual percentage change. The Line Chart allows you to clearly see the changes of data over the time.
HelpDesk
How to Draw a Scatter Diagram Using ConceptDraw PRO

Pie Chart Word Template. Pie Chart Examples

Picture Graph

How to Draw a Line Graph

Chart Maker for Presentations

Bar Chart Template for Word

You can quickly rework these bar graph templates into your own charts by simply changing displayed data, title and legend texts.
Chart Templates

Process Flowchart


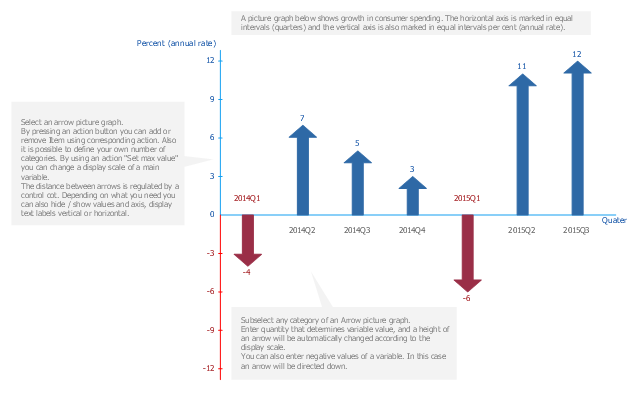
A picture chart (image chart, pictorial graph) is the type of a bar graph visualizing numarical data using symbols and pictograms.
In the field of economics and finance use a picture graph with columns in the form of coins. For population comparison statistics use a chart with columns in the form of manikins. To show data increase or decrease use arrows bar charts.
The arrow chart template "Picture graph" for the ConceptDraw PRO diagramming and vector drawing software is included in the Basic Picture Graphs solution from the Graphs and Charts area of ConceptDraw Solution Park.
Arrows bar graph template
Column Chart Template

Use this vertical bar chart template to design your column charts in the ConceptDraw PRO diagramming and vector drawing software.
"Bar graphs can ... be used for more complex comparisons of data with grouped bar charts and stacked bar charts. In a grouped bar chart, for each categorical group there are two or more bars. These bars are color-coded to represent a particular grouping. For example, a business owner with two stores might make a grouped bar chart with different colored bars to represent each store: the horizontal axis would show the months of the year and the vertical axis would show the revenue. Alternatively, a stacked bar chart could be used. The stacked bar chart stacks bars that represent different groups on top of each other. The height of the resulting bar shows the combined result of the groups. However, stacked bar charts are not suited to datasets where some groups have negative values. In such cases, grouped bar charts are preferable." [Bar chart. Wikipedia]
The column chart template "Double bar graph" is included in the Basic Bar Graphs solution from the Graphs and Charts area of ConceptDraw Solution Park.
Template

Basic Diagramming


Rainfall Bar Chart

This sample was created in ConceptDraw PRO diagramming and vector drawing software using the Bar Graphs Solution from the Graphs and Charts area of ConceptDraw Solution Park.
 Line Graphs
How to draw a Line Graph with ease? The Line Graphs solution extends the capabilities of ConceptDraw PRO v10 with professionally designed templates, samples, and a library of vector stencils for drawing perfect Line Graphs.
- Line Chart Template for Word | How to Draw a Scatter Diagram ...
- Product life cycle graph - Template | Product life cycle graph | Draw ...
- Line Graphs | How to Draw a Line Graph | Line Graph Charting ...
- Line graph - Template
- Product life cycle graph - Template | Draw Flowcharts with ...
- Line Chart Examples | Line Chart Template for Word | How to Create ...
- Line Chart Template for Word | Draw Fishbone Diagram on MAC ...
- Triangular Graph Template
- Product life cycle graph - Template | Pie Chart Word Template . Pie ...
- Line Graph Templates Ppt
- Picture Graphs | Picture Graph | How to Create a Picture Graph in ...
- Bar Graph Template Population Increase
- Bar Diagram Math | Divided Bar Diagrams | Double bar graph ...
- Scatter graph - Template | Line graph - Template | Picture graph ...
- Triangle Graph Template
- Normal distribution graph - Template | Competitor Analysis ...
- Basic Diagramming | Line Chart Template for Word | How to Create ...
- Bar Graphs | Picture Graphs | Sales Growth. Bar Graphs Example ...
- How to Draw a Line Graph | Line Graphs | Line Graph | Line Graph Of
- Product life cycle graph - Template | Circular Flow Diagram ...
- ERD | Entity Relationship Diagrams, ERD Software for Mac and Win
- Flowchart | Basic Flowchart Symbols and Meaning
- Flowchart | Flowchart Design - Symbols, Shapes, Stencils and Icons
- Flowchart | Flow Chart Symbols
- Electrical | Electrical Drawing - Wiring and Circuits Schematics
- Flowchart | Common Flowchart Symbols
- Flowchart | Common Flowchart Symbols