Process Flowchart
ConceptDraw is Professional business process mapping software for making process flow diagram, workflow diagram, general flowcharts and technical illustrations for business documents. It is includes rich examples, templates, process flowchart symbols. ConceptDraw flowchart maker allows you to easier create a process flowchart. Use a variety of drawing tools, smart connectors, flowchart symbols and shape libraries to create flowcharts of complex processes, process flow diagrams, procedures and information exchange.
HelpDesk
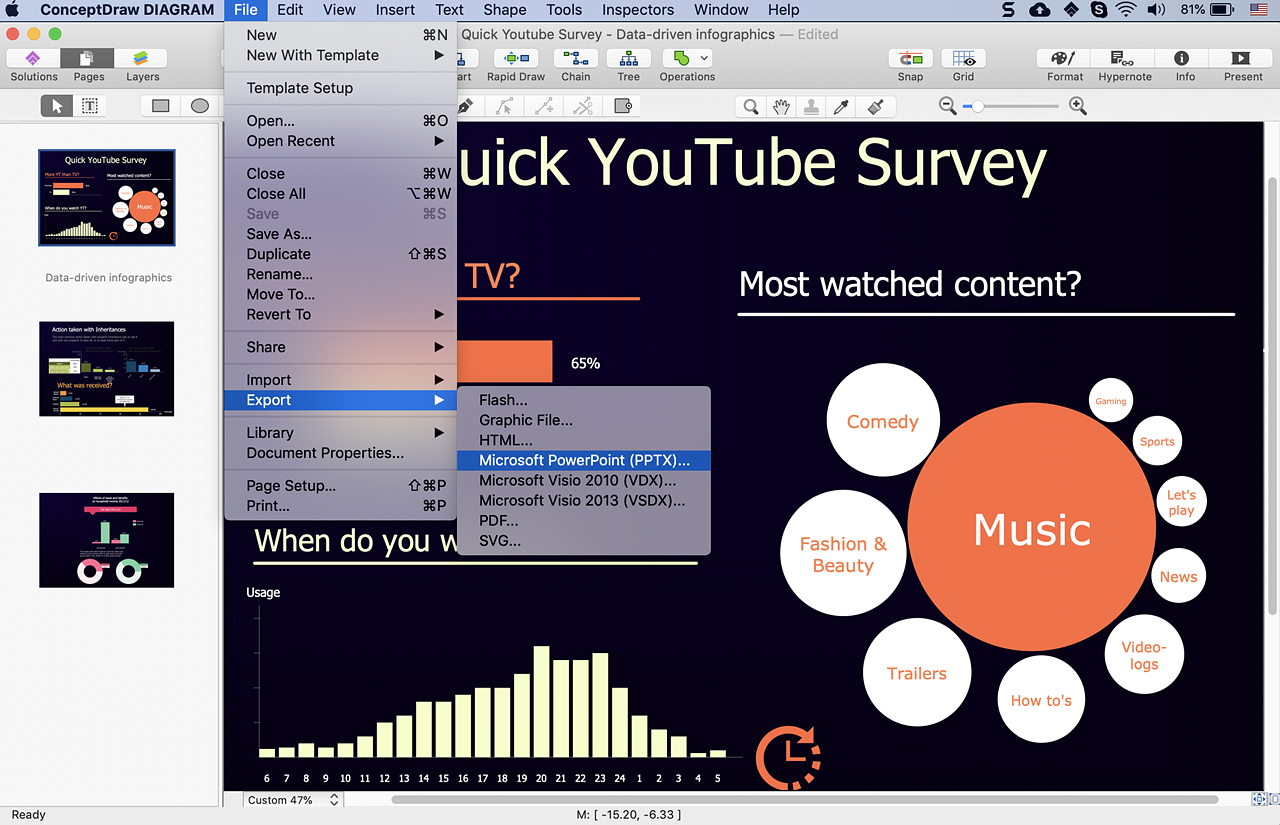
How to Create Data-driven Infographics
Data-driven infographics are used in wildly disparate areas of business and commerce. To make effective Data-driven infographics, it's useful to have a wide variety of graphical elements — icons, clipart, stencils, charts and graphs — to illustrate your diagram. ConceptDraw Data-driven Infographics solution provides all the tools you need to present data as described by this article — as well as the charts mentioned previously, you can find histograms, divided bar charts, ring charts, line graphs and area charts — meaning you can find the perfect medium for displaying a certain type of data. It allows you to draw data driven infographics quickly and easily using the special templates and vector stencils libraries.It can be used to quickly communicate a message, to simplify the presentation of large amounts of data, to see data patterns and relationships, and to monitor changes in variables over time.Components of ER Diagram
ConceptDraw gives the ability to draw ER diagram (ERD) for visual describing database using the entity relationship symbols, work flow shapes, entity relationship stencils. Entity-Relationship model making possibility to describe a database using the components of ER Diagram in which in the tables data can be the point to data in other tables - for instance, your entry in the database could point to several entries.Entity Relationship Diagram Symbols
Creating an entity-relationship (ER) model is to visually represent the structure of a business database, where data equates to entities (or objects) that are linked by defined relationships expressing dependencies and requirements. By nature it is an abstract visualization, the first step in the design process towards creating a logical and functional database.ERD symbols used for professional ERD drawing are collected in libraries from the Entity-Relationship Diagram (ERD) solution for ConceptDraw PRO.
Example of DFD for Online Store (Data Flow Diagram) DFD Example
Data flow diagrams (DFDs) reveal relationships among and between the various components in a program or system. DFDs are an important technique for modeling a system’s high-level detail by showing how input data is transformed to output results through a sequence of functional transformations.Example of DFD for Online Store shows the Data Flow Diagram for online store and interactions between the Visitors, Customers and Sellers, as well as Website Information and User databases.

Create Flowchart
The Flowchart is a very popular type of diagram, it is widely used for analyzing, designing, managing and visualizing the business and technical processes, various software algorithms. But how to create Flowchart quick and easy?Flowcharts solution from the Diagrams area of ConceptDraw Solution Park helps you to design the professional looking Flowchart Diagrams quick and easy using the ConceptDraw PRO diagramming and vector drawing software.
Data Flow Diagram Model
The DFD (Yourdon and Coad notation) example "Model of small traditional production enterprise" below was created using the ConceptDraw PRO diagramming and vector drawing software extended with the Data Flow Diagrams solution from the Software Development area of ConceptDraw Solution Park.HelpDesk
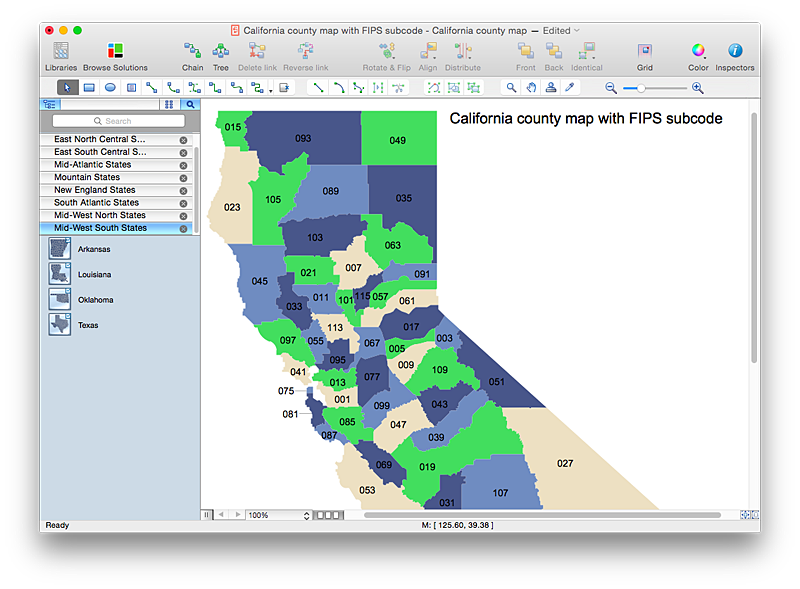
How to Draw a Map of USA States Using ConceptDraw PRO
You can found a huge set of geopolitical statistical data regarding America. A common way of visualizing this data is to create maps that connect a particular data in relation to a specific geographical area. Thematic maps are used to depict such data as population density, average rainfall, or political allegiance, representing the data by using visual elements and annotation. Thematic maps always focus on one particular subject matter unlike general reference maps, which display information on a different subjects — vegetation, topology, roads and highways, etc.The United States Mapping Solution for ConceptDraw PRO includes all of the US States with county outlined borders, from the largest, San Bernardino in California, to the smallest Kalawao County, Hawaii.
HelpDesk
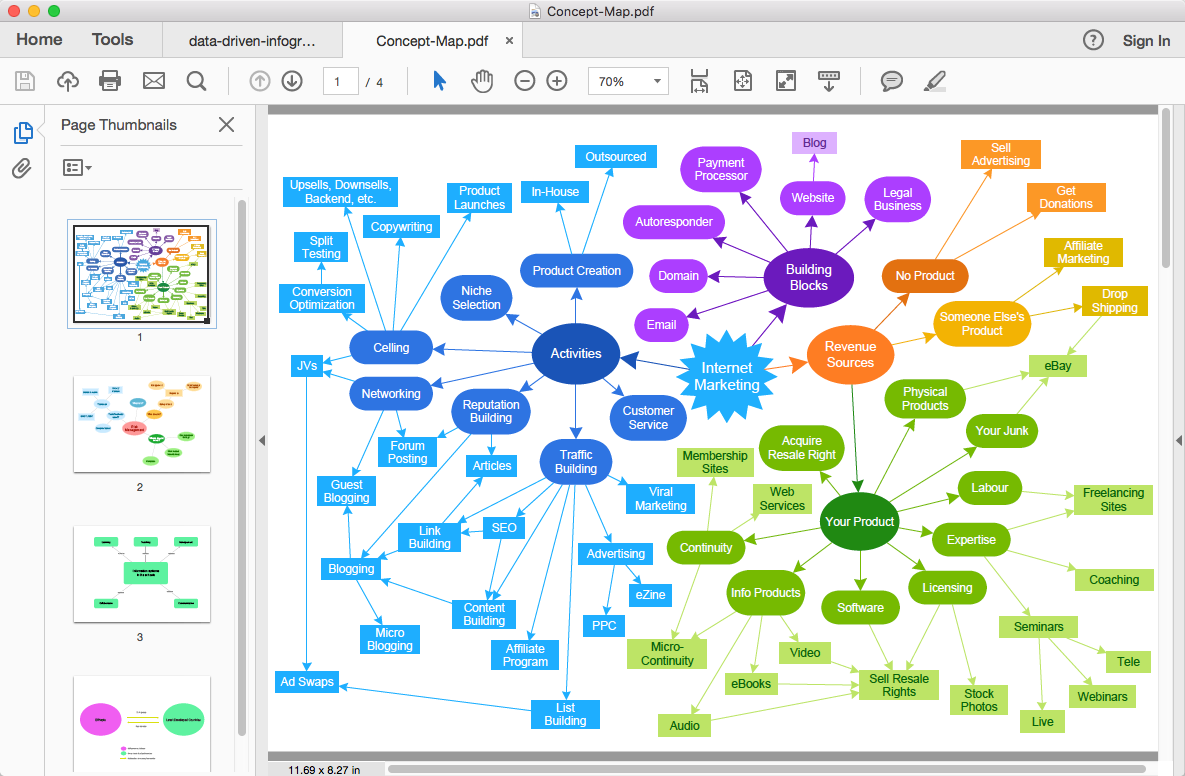
How To Convert a Concept Map to Adobe PDF
ConceptDraw PRO allows you to easy share your concept maps between different computers with different operating systems and applications using it's export capabilities.You can get clear business graphic pack in pdf format and easily communicate it with stakeholders.HelpDesk
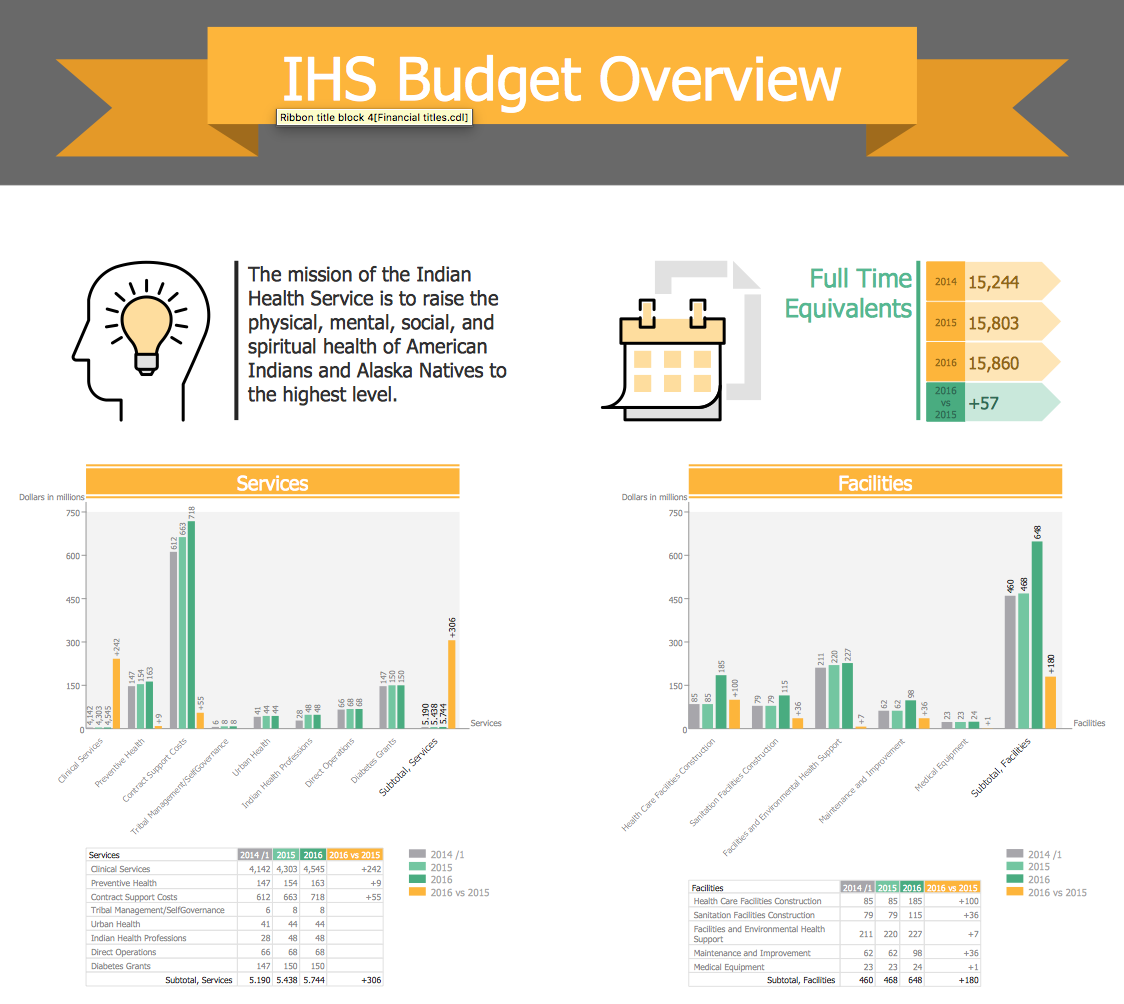
How to Create Financial Infographics
Making Infographics is an ideal choice for organizing attractive and interesting financial presentations, detailed financial reports. Infographics are rather helpful for depiction the basic concepts of financial management and principles of management the cash flows, for implementing the financial analysis and construction financial forecasts. The Financial Infographics solution for ConceptDraw PRO contains pre-designed samples, templates to be filled in, and libraries of vector design elements of financial symbols, charts, indicators, maps, lists, titles, callouts, etc.- How to Create a Data Flow Diagram using ConceptDraw PRO | Pdf ...
- Draw The Pdf Of Data
- How To Draw Dfd Diagram Pdf
- Cubetto Flowchart | Drawing Flow Chart Methods Pdf
- Pdf File For All Level Of Data Flow Diagram
- Data Flow Diagrams (DFD) | Dfd For Social Networking Site Pdf
- How to Create a Data Flow Diagram using ConceptDraw PRO | Data ...
- How to Create a Data Flow Diagram using ConceptDraw PRO | Data ...
- How to Create a Data Flow Diagram using ConceptDraw PRO | Pdf ...
- Visio Files and ConceptDraw | Dfd Diagram Symbols And Meaning Pdf
- ERD | Entity Relationship Diagrams, ERD Software for Mac and Win
- Flowchart | Basic Flowchart Symbols and Meaning
- Flowchart | Flowchart Design - Symbols, Shapes, Stencils and Icons
- Flowchart | Flow Chart Symbols
- Electrical | Electrical Drawing - Wiring and Circuits Schematics
- Flowchart | Common Flowchart Symbols
- Flowchart | Common Flowchart Symbols


