 Chemical and Process Engineering
This chemical engineering solution extends ConceptDraw DIAGRAM.9.5 (or later) with process flow diagram symbols, samples, process diagrams templates and libraries of design elements for creating process and instrumentation diagrams, block flow diagrams (BFD
Piping and Instrumentation Diagram Software

Plumbing and Piping Plans solution helps you create quick and easy: key piping and instrument details ,piping diagrams, instrumentation diagrams, schemes of hot and cold water supply systems, control and shutdown schemes, diagrams of plumbing systems, heating schemes, schematics of waste water disposal systems, safety and regulatory requirements, diagrams of ventilation systems, mechanical diagrams, industrial diagrams, basic start up and operational information.
Cross-Functional Flowchart

Use cross-functional flowcharts to show the relationship between a business process and the functional units (such as departments) responsible for that process. To create it use the best flowchart maker of ConceptDraw DIAGRAM.

Process Flow Diagram Symbols

ERD Symbols and Meanings

The Chen's ERD notation is still used and is considered to present a more detailed way of representing entities and relationships.
To create an ERD, software engineers mainly turn to dedicated drawing software, which contain the full notation resources for their specific database design - ERD symbols and meanings. CS Odessa has released an all-inclusive Entity-Relationship Diagram (ERD) solution for their powerful drawing program, ConceptDraw DIAGRAM.

How To use House Electrical Plan Software

You can use many of built-in templates, electrical symbols and electical schemes examples of our House Electrical Diagram Software.
ConceptDraw is a fast way to draw: Electrical circuit diagrams, Schematics, Electrical Wiring, Circuit schematics, Digital circuits, Wiring in buildings, Electrical equipment, House electrical plans, Home cinema, Satellite television, Cable television, Closed-circuit television.
House Electrical Plan Software works across any platform, meaning you never have to worry about compatibility again. ConceptDraw DIAGRAM allows you to make electrical circuit diagrams on PC or macOS operating systems.

How To Create Onion Diagram

But how to create Onion Diagram? Now, it's very easy thanks to the ConceptDraw DIAGRAM diagramming and vector drawing software extended with Stakeholder Onion Diagrams Solution from the Management Area of ConceptDraw Solution Park.
Chemical Engineering

Electrical Symbols — Analog and Digital Logic
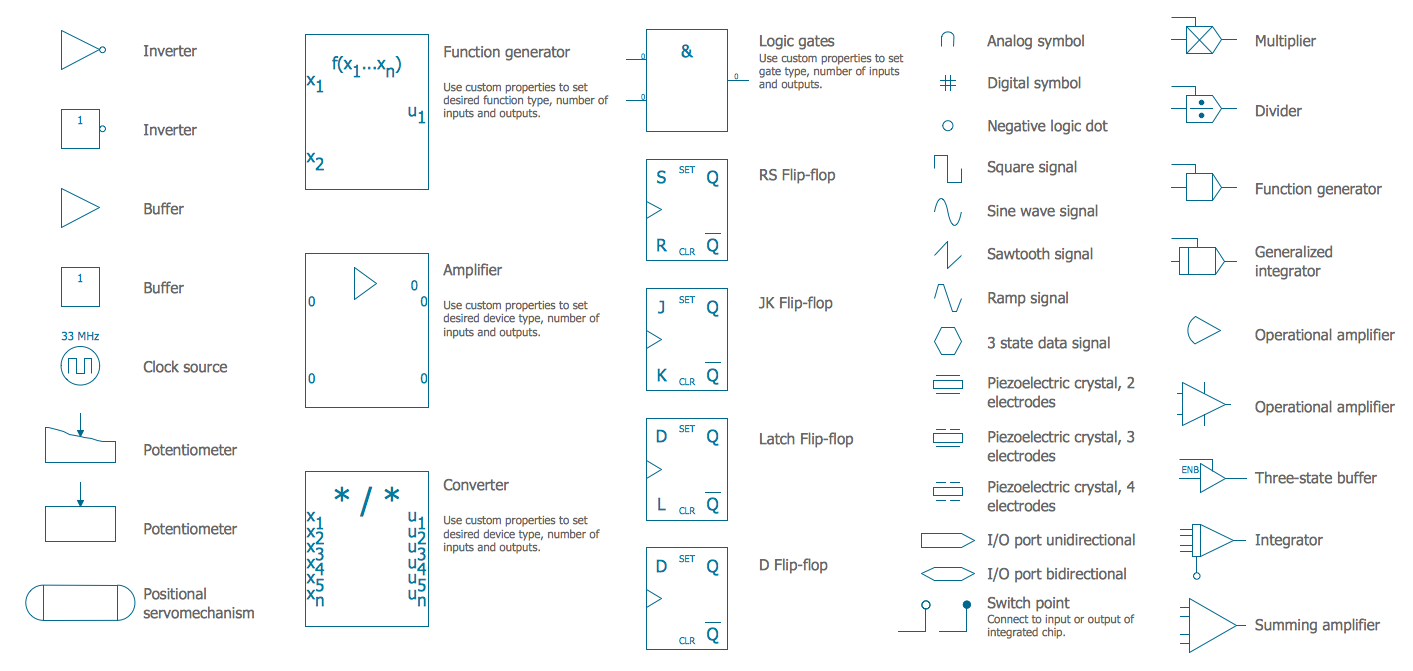
26 libraries of the Electrical Engineering Solution of ConceptDraw DIAGRAM make your electrical diagramming simple, efficient, and effective. You can simply and quickly drop the ready-to-use objects from libraries into your document to create the electrical diagram.
 macOS User Interface
macOS User Interface solution extends the ConceptDraw DIAGRAM functionality with powerful GUI software graphic design features and tools. It provides an extensive range of multifarious macOS Sierra user interface design examples, samples and templates, and wide variety of libraries, containing a lot of pre-designed vector objects of Mac Apps icons, buttons, dialogs, menu bars, indicators, pointers, controls, toolbars, menus, and other elements for fast and simple designing high standard user interfaces of any complexity for new macOS Sierra.
- Free Download Software Conceptdraw For Pfd And Pid
- Process Flow Diagram Symbols | Evaporator P
- Chemical and Process Engineering | How to Draw a Chemical ...
- Design elements - Valves and fittings | P Id Software Open Source
- Drawing Online Download
- Process Flow Diagram Symbols | Design elements - Heating ...
- Chemical and Process Engineering | Chemical Engineering ...
- What Is P Id
- Electrical Symbols, Electrical Diagram Symbols | Electrical Symbols ...
- Plant Layout Plans | Chemical and Process Engineering | Chemical ...
- ERD | Entity Relationship Diagrams, ERD Software for Mac and Win
- Flowchart | Basic Flowchart Symbols and Meaning
- Flowchart | Flowchart Design - Symbols, Shapes, Stencils and Icons
- Flowchart | Flow Chart Symbols
- Electrical | Electrical Drawing - Wiring and Circuits Schematics
- Flowchart | Common Flowchart Symbols
- Flowchart | Common Flowchart Symbols