This site uses cookies. By continuing to browse the ConceptDraw site you are agreeing to our Use of Site Cookies.

Electrical Symbols, Electrical Diagram Symbols

How to create Electrical Diagram? It’s very easy! All you need is a powerful software. It wasn’t so easy to create Electrical Symbols and Electrical Diagram as it is now with electrical diagram symbols offered by the libraries of Electrical Engineering Solution from the Industrial Engineering Area at the ConceptDraw Solution Park.
This solution provides 26 libraries which contain 926 electrical symbols from electrical engineering: Analog and Digital Logic, Composite Assemblies, Delay Elements, Electrical Circuits, Electron Tubes, IGFET, Inductors, Integrated Circuit, Lamps, Acoustics, Readouts, Logic Gate Diagram, MOSFET, Maintenance, Power Sources, Qualifying, Resistors, Rotating Equipment, Semiconductor Diodes, Semiconductors, Stations, Switches and Relays, Terminals and Connectors, Thermo, Transformers and Windings, Transistors, Transmission Paths,VHF UHF SHF.

Cisco Routers. Cisco icons, shapes, stencils and symbols

Network infrastructure planning is a very important process in the network construction, and the share of time allocated to this within the scope of the entire project may reach 60-80%. A competent and thorough approach to planning contributes to the quick investment return, and also increases the reliability and flexibility of the final system, reducing the probability of additional costs related to the incorrect implementation.
Any planning begins with an analysis of the business requirements to the final system. Basic network parameters, which should be assessed are the scalability, accessibility, cost, speed and safety.
Speed and cost are often mistaken for the most important parameters, and the rest of the parameters aren't even remembered. This is not entirely correct. Initially, it is necessary to assess the business plans for the future, because sometimes it is more profitable to invest more money in the beginning. If the business is to develop, then, consequently, demands on

Process Flowchart

ConceptDraw is Professional business process mapping software for making process flow diagram, workflow diagram, general flowcharts and technical illustrations for business documents. It is includes rich examples, templates, process flowchart symbols. ConceptDraw flowchart maker allows you to easier create a process flowchart. Use a variety of drawing tools, smart connectors, flowchart symbols and shape libraries to create flowcharts of complex processes, process flow diagrams, procedures and information exchange.
How To Create a Process Flow Chart (business process modelling techniques)

Local area network (LAN). Computer and Network Examples

A local area network (LAN) is a devices network that connect with each other in the scope of a home, school, laboratory, or office. Usually, a LAN comprise computers and peripheral devices linked to a local domain server. All network appliances can use a shared printers or disk storage. A local area network serve for many hundreds of users. Typically, LAN includes many wires and cables that demand a previously designed network diagram. They are used by IT professionals to visually document the LANs physical structure and arrangement.
ConceptDraw - Perfect Network Diagramming Software with examples of LAN Diagrams. ConceptDraw Network Diagram is ideal for network engineers and network designers who need to draw Local Area Network diagrams.
How to Draw a Computer Network

Baseball Diagram – Colored Baseball Field

Extending ConceptDraw DIAGRAM software with the Baseball solution from the ConceptDraw Solution Park you receive a complete set of libraries, templates and samples allowing to draw baseball diagrams in seconds. You can start from a template, change positions and get ready diagram in some clicks.

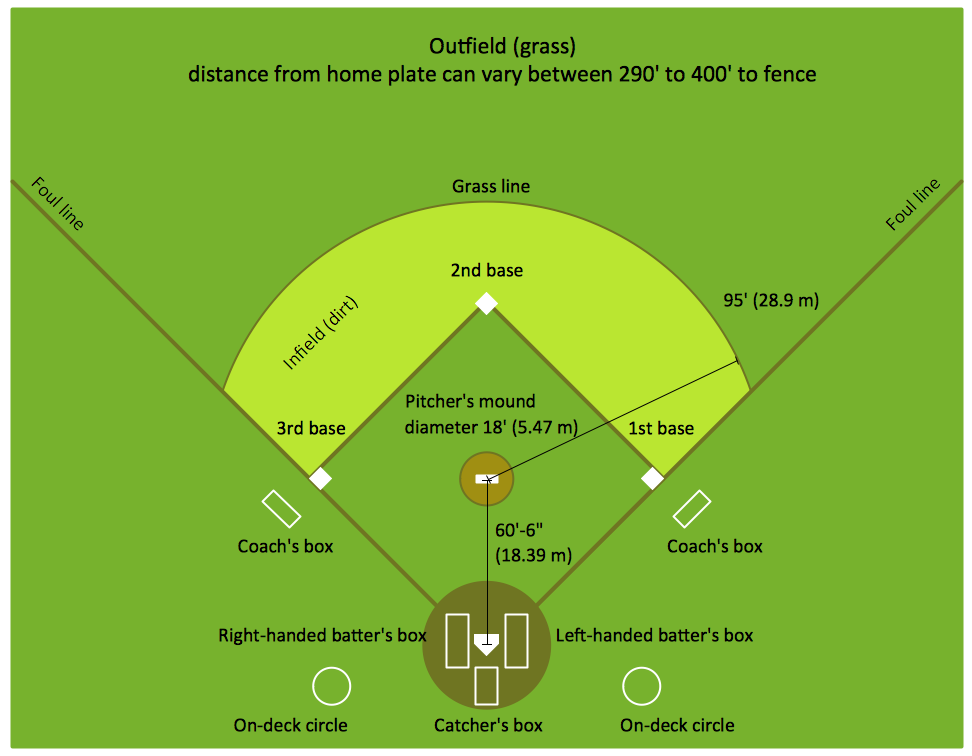
Baseball Field Sample

ConceptDraw DIAGRAM extended with the Baseball solution provides access to libraries, templates and samples allows creating baseball diagrams and schemas. Fields objects are designed according to real fields dimensions. A set of fields samples includes dimensions. All plays and positions diagrams are available as ready-to-modify samples.

How to create a UML Diagram

ConceptDraw DIAGRAM extended with the Rapid UML solution is perfect for drawing professional UML diagrams.

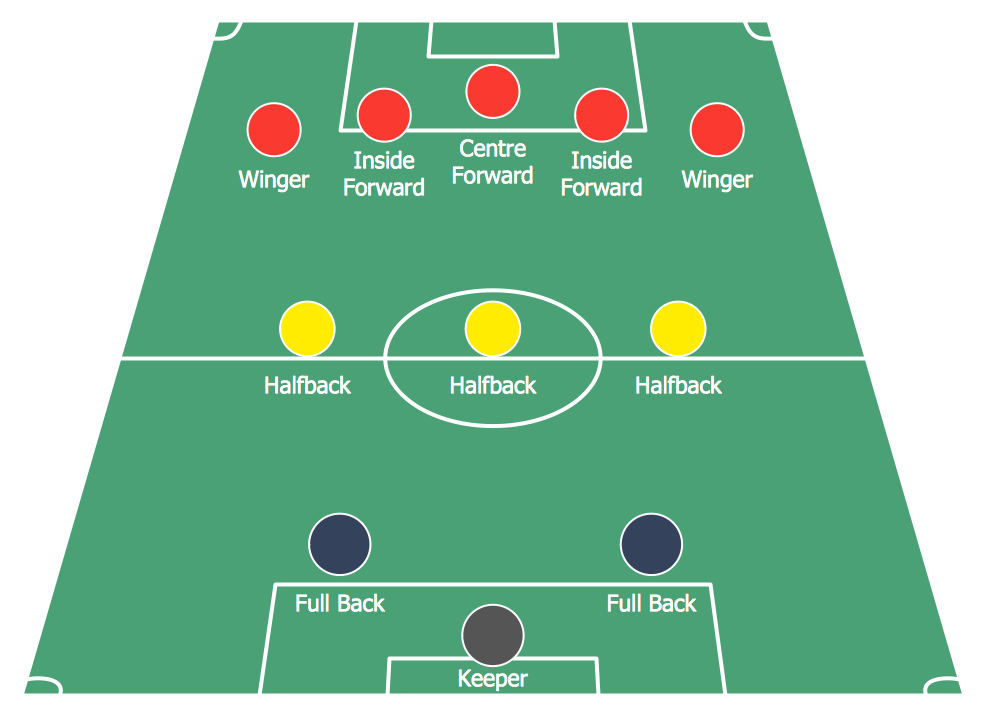
Soccer (Football) Formation

Using diagrams is the easiest way to explain the soccer formations. The Soccer solution from the Sport area of ConceptDraw Solution Park is designed as a tool that helps you produce the soccer diagrams in a few minutes. The predesigned samples of the Soccer solution for ConceptDraw DIAGRAM depict the most popular formation diagrams.
HelpDesk

How to Design a Fast-Food Restaurant Menu

Food menus are a crucial part of the catering business. When designing your menu for a fast-food restaurant, you want to create a list of meals that which looks professional and attractive. Just the image of food will get guests a pleasant expectation. Adds use the best images to present tempting dishes. Restaurants and fast-food joints add images of their best dishes to the menu — even if what you see isn't always exactly what you get!
The ConceptDraw Food Court solution provides users with a collection of library objects and example drawings for ConceptDraw DIAGRAM makes short work of drawing professional visualizations related to the catering business.

Network Diagram Software. LAN Network Diagrams. Physical Office Network Diagrams

ConceptDraw Network Diagramming Software with examples of WAN, LAN Diagrams. ConceptDraw Network Diagram is ideal for network engineers and network designers who need to draw Local Area Network diagrams, physical office network diagrams and Diagram for LAN.
How to Draw a Computer Network
HelpDesk

How to Draw the Different Types of Pie Charts

Using a Pie Chart, you can visually estimate the relative contribution that different data categories contribute to a whole value. The pie chart displays the statistics in a visual format. The main use of pie charts to show comparisons. The larger piece of the pie, the more the value of this value compared to the rest. Various applications of pie charts can be found in business and education. For business, pie charts can be used to compare the success or failure of the goods or services. They may also be used to display the business market share.
HelpDesk

How to Create a Floor Plan
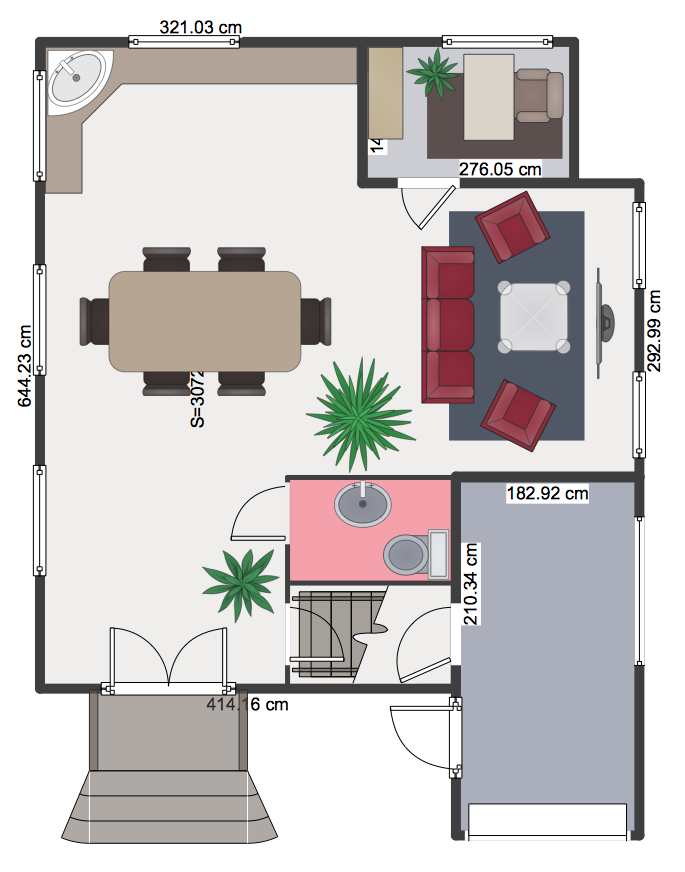
Making a floor plan is the best way to get a handle on how to organize your living space and find out what could be changed. Creating a floor plan to scale is a challenge of the home and interior design process and can be noticeably helpful for visualizing things like furniture layout. You can use ConceptDraw DIAGRAM to produce layouts of real estate properties. ConceptDraw DIAGRAM contains the large quantity of pre-designed vector objects that you can use for quick and easy designing such floor plans. You can easily determine the size of the rooms and distances in your drawing. The ability to create a floor plan is delivered by the Floor Plans solution. This solution extends ConceptDraw DIAGRAM with libraries that contain over 500 objects of floor plan elements. There is a set of special objects that display the sizes, corners, squares and other technical details using the current measurements of units.
HelpDesk

How to Create a Bar Chart

Bar charts (bar graphs) are diagrams displaying data as horizontal or vertical bars of certain heights. Bar charts are widely used to show and compare the values of the same parameters for different data groups.
The bar graph can be vertical or horizontal. This depends on the number of categories. There are many methods in which bar graph can be built and this makes it a very often used chart type. Usually, a bar chart is created so that the bars are placed vertically. Such an arrangement means that the bar's height value is proportional to the category value. Nevertheless, a bar chart can be also drawn horizontally. This means that the longer the bar, the bigger the category. Thus, a bar chart is a good way to present the relative values of different measured items. The ConceptDraw Bar Graphs solution allows you to draw a bar chart quickly using a vector library, containing the set of various bar charts objects.

Ice Hockey Positions Diagram

ConceptDraw Ice Hockey Solution for ConceptDraw DIAGRAM delivers the "Ice Hockey Positions" library that contains predesigned objects for all ice hockey positions. A set of templates and samples demonstrates best practice of using this library.
HelpDesk

How to Create Infographics that Help People Eat Healthy

The most effective manner of presenting information on a healthy diet and food nutrition is using various visualizations such as charts or infographics. To help easily create infographics and diagrams of healthy eating, ConceptDraw has provided the Health Food solution to its Solution Park. It contains vector stencil libraries of healthy eating options, samples of diagrams and infographics, and a set of templates to help you create your own diagrams, infographics and even adds. Using ConceptDraw DIAGRAM you can easily create and share healthy food recipes and materials about the proper nutrition.