Electrical Symbols, Electrical Diagram Symbols

This solution provides 26 libraries which contain 926 electrical symbols from electrical engineering: Analog and Digital Logic, Composite Assemblies, Delay Elements, Electrical Circuits, Electron Tubes, IGFET, Inductors, Integrated Circuit, Lamps, Acoustics, Readouts, Logic Gate Diagram, MOSFET, Maintenance, Power Sources, Qualifying, Resistors, Rotating Equipment, Semiconductor Diodes, Semiconductors, Stations, Switches and Relays, Terminals and Connectors, Thermo, Transformers and Windings, Transistors, Transmission Paths,VHF UHF SHF.
Entity Relationship Diagram Symbols

ERD symbols used for professional ERD drawing are collected in libraries from the Entity-Relationship Diagram (ERD) solution for ConceptDraw DIAGRAM.
ERD Symbols and Meanings

The Chen's ERD notation is still used and is considered to present a more detailed way of representing entities and relationships.
To create an ERD, software engineers mainly turn to dedicated drawing software, which contain the full notation resources for their specific database design - ERD symbols and meanings. CS Odessa has released an all-inclusive Entity-Relationship Diagram (ERD) solution for their powerful drawing program, ConceptDraw DIAGRAM.

Local area network (LAN). Computer and Network Examples
 diagram")
ConceptDraw - Perfect Network Diagramming Software with examples of LAN Diagrams. ConceptDraw Network Diagram is ideal for network engineers and network designers who need to draw Local Area Network diagrams.

Basic Flowchart Symbols and Meaning


Process Flowchart


Flowchart design. Flowchart symbols, shapes, stencils and icons

Mavericks have always desired to stand apart and gorgeous design is the recipe for that. Any business graphic document will be more understandable if will use an expository color scheme for their parts. Flowchart design makes versatile presenting and explaining of the process and gives a fresh view that distinguishes it from black and white flowcharts on a paper. Workflow diagram or process flow diagrams become more understandable to ordinary people when it use minimum symbols and special signs.
The best design can be accomplished by starting from any of the suitable Conceptdraw examples. Pick one of them and begin to input proper text into each Flowchart symbols and shapes. Apply less colors in the document and don't turn into rainbow your diagram, three or four will be enough, also note that business process flowchart may not contain bright color hues. The next clue is to use identical colors for same flowchart shape types.

Graphical Symbols to use in EPC diagrams

ConceptDraw DIAGRAM - software that reduces the time needed to create a business process model.
Data Flow Diagram Symbols. DFD Library

Flowchart Maker

Business graphic applications show a special knowledge representations and include many features for creating schematic pictures. These graphic tools are known as flowchart maker or flowchart maker software.
Electrical Symbols — MOSFET

Although the MOSFET is a four-terminal device with source (S), gate (G), drain (D), and body (B) terminals, the body (or substrate) of the MOSFET is often connected to the source terminal, making it a three-terminal device like other field-effect transistors. Because these two terminals are normally connected to each other (short-circuited) internally, only three terminals appear in electrical diagrams. The MOSFET is by far the most common transistor in both digital and analog circuits, though the bipolar junction transistor was at one time much more common.
26 libraries of the Electrical Engineering Solution of ConceptDraw DIAGRAM make your electrical diagramming simple, efficient, and effective. You can simply and quickly drop the ready-to-use objects from libraries into your document to create the electrical diagram.
What is Entity-Relationship Diagram

The vector graphic ER diagrams produced when using ConceptDraw ERD solution can be used in whitepapers, presentations, datasheets, posters, or any technical materials.
Anyone Have an ERD Symbols Quick Reference?

But anyone have an ERD symbols quick reference? Detailed reference information for them is represented at the tables.
Components of ER Diagram

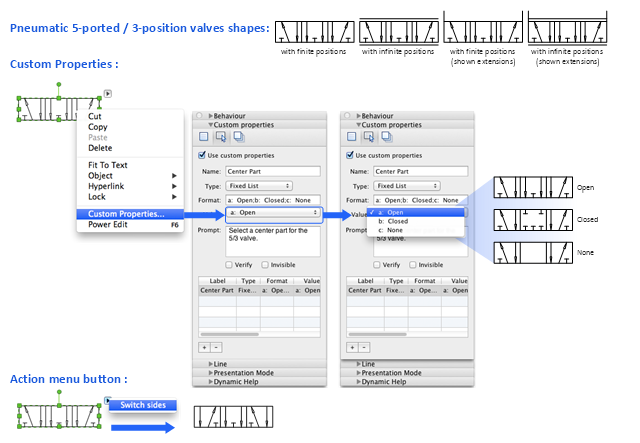
"Directional control valves are one of the most fundamental parts in hydraulic machinery as well and pneumatic machinery. They allow fluid flow into different paths from one or more sources. They usually consist of a spool inside a cylinder which is mechanically or electrically controlled. The movement of the spool restricts or permits the flow, thus it controls the fluid flow. ...
While working with layouts of hydraulic machinery it is cumbersome to draw actual picture of every valve and other components.instead of pictures symbols are used for variety of components in the hydraulic system to highlight the functional aspects. symbol for directional control valve is made of number of square boxes adjacent to each other depending on the number of positions.connections to the valve are shown on these squares by capital letters.usually they are named only in their normal position and not repeated in other positions.actuation system of the valve is also designated in its symbol." [Directional control valve. Wikipedia]
The Mac template "Pneumatic 5-ported 3-position valve" for the ConceptDraw PRO diagramming and vector drawing software is included in the Mechanical Engineering solution from the Engineering area of ConceptDraw Solution Park.
www.conceptdraw.com/ solution-park/ engineering-mechanical
Pneumatic directional control valve
Network Diagram Software. LAN Network Diagrams. Physical Office Network Diagrams

Aerospace - Design Elements

Mechanical Drawing Software

Pyramid Diagram


- | Mention Five Flowchart Symbols And Their Function Or Use
- Draw Five Symbols Used In Flow Chart
- List And Draw 10 Flow Chart Symbols And Their Uses
- List Ten Flowchart Symbols And Their Uses
- List Five Flowchart Symbols And Their Features
- Mention And Explain Five Flowchart Symbols
- Basic Flowchart Symbols and Meaning | Flowchart Components ...
- Basic Flowchart Symbols and Meaning | Process Flow Chart Symbol ...
- Telecommunication Network Diagrams | Block Diagrams | Draw Five ...
- Electrical Symbols , Electrical Diagram Symbols
- Draw Ten Building Symbol
- Basic Flowchart Symbols and Meaning | Types of Flowcharts | Entity ...
- Chemistry Drawing Software | Chemistry Symbols and Meanings ...
- Project management life cycle - Flowchart | Five Type Of Flowchat
- Welded joints types | Butt weld geometry | Elements location of a ...
- Welded joints types | Butt weld geometry | Welding symbols | Types ...
- Butt weld geometry | Welding symbols | Welded joints types | Weld ...
- Draw A Triangle With Five Levels Identify The Five Levels Of Needs
- Health Food | State Five Functions Of Flowchart
- Mechanical Drawing Symbols
- ERD | Entity Relationship Diagrams, ERD Software for Mac and Win
- Flowchart | Basic Flowchart Symbols and Meaning
- Flowchart | Flowchart Design - Symbols, Shapes, Stencils and Icons
- Flowchart | Flow Chart Symbols
- Electrical | Electrical Drawing - Wiring and Circuits Schematics
- Flowchart | Common Flowchart Symbols
- Flowchart | Common Flowchart Symbols