This pie chart sample shows the atmosphere air composition. It was designed on the base of the Wikimedia Commons file: Air composition pie chart.JPG.
[commons.wikimedia.org/ wiki/ File:Air_ composition_ pie_ chart.JPG]
This file is licensed under the Creative Commons Attribution-Share Alike 3.0 Unported license. [creativecommons.org/ licenses/ by-sa/ 3.0/ deed.en]
"The atmosphere of Earth is a layer of gases surrounding the planet Earth that is retained by Earth's gravity. The atmosphere protects life on Earth by absorbing ultraviolet solar radiation, warming the surface through heat retention (greenhouse effect), and reducing temperature extremes between day and night (the diurnal temperature variation).
The common name given to the atmospheric gases used in breathing and photosynthesis is air. By volume, dry air contains 78.09% nitrogen, 20.95% oxygen, 0.93% argon, 0.039% carbon dioxide, and small amounts of other gases. Air also contains a variable amount of water vapor, on average around 1%. Although air content and atmospheric pressure vary at different layers, air suitable for the survival of terrestrial plants and terrestrial animals currently is only known to be found in Earth's troposphere and artificial atmospheres." [Atmosphere of Earth. Wikipedia]
The pie chart example "Atmosphere air composition" was created using the ConceptDraw PRO diagramming and vector drawing software extended with the Pie Charts solution of the Graphs and Charts area in ConceptDraw Solution Park.
Pie chart

Beauty in nature Illustrations and Clipart

Drawing a Nature Scene
Bubble diagrams in Landscape Design with ConceptDraw DIAGRAM

Technical Flow Chart Example

ConceptDraw DIAGRAM enhanced with Flowcharts Solution from the "Diagrams" Area of ConceptDraw Solution is a perfect software for drawing Technical Flow Chart Example illustrating the essence and importance of the technical flow chart use.
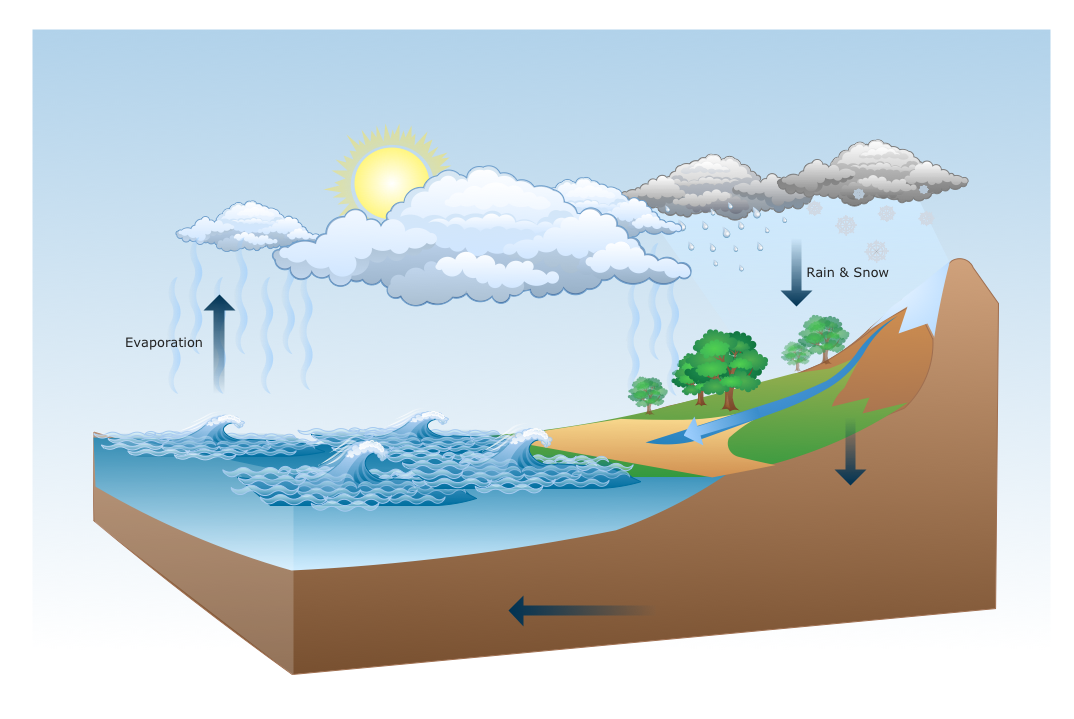
This Water cycle diagram example was drawn using the ConceptDraw PRO diagramming and vector graphics software extended with the clipart libraries Geography and Weather.
"The water cycle, also known as the hydrologic cycle or the H2O cycle, describes the continuous movement of water on, above and below the surface of the Earth. The mass water on Earth remains fairly constant over time but the partitioning of the water into the major reservoirs of ice, fresh water, saline water and atmospheric water is variable depending on a wide range of climatic variables. The water moves from one reservoir to another, such as from river to ocean, or from the ocean to the atmosphere, by the physical processes of evaporation, condensation, precipitation, infiltration, runoff, and subsurface flow. In so doing, the water goes through different phases: liquid, solid (ice), and gas (vapor)." [Water cycle. Wikipedia]
This water cycle diagram example is included in the Nature solution from the Illustration area of ConceptDraw Solution Park.
Vector illustration

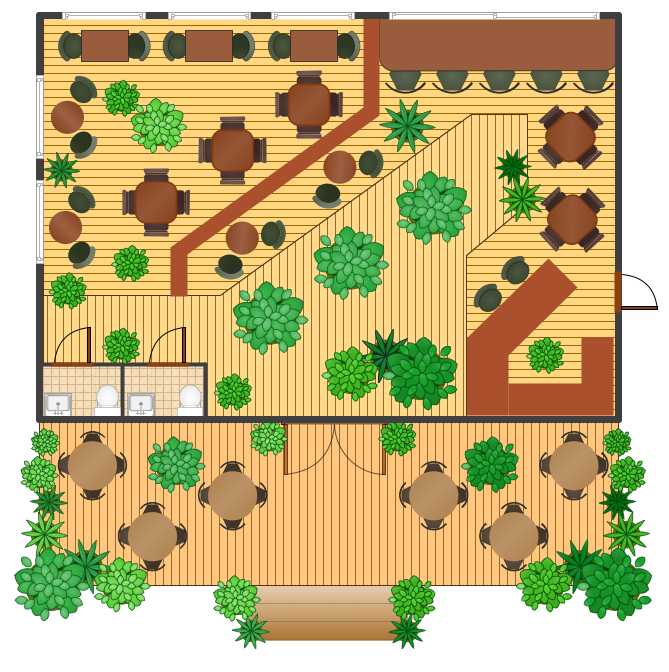
Restaurant Floor Plan Software

You can create quick custom designs of: Restaurant layouts, Restaurant Floor plans,
Restaurant Design with our Restaurant Floor Plans Software.
 Nature
This solution extends ConceptDraw DIAGRAM software with samples, templates and libraries of vector clipart for drawing the Nature illustrations. Use it to make professional-looking documents, presentations and websites illustrated with color scalable vector c
Interior Design. Office Layout Plan Design Element

ConceptDraw Building Drawing Tools - draw simple office layout plans easily with Office Layout Plan Design Element. Use it to draw office interior design floor plans, office furniture and equipment layouts, and blueprints for facilities management, move management, office supply inventories, assets inventories, office space planning.

Cafe Design
- Atmosphere air composition | Percentage Pie Chart . Pie Chart ...
- Draw A Diagram Showing Composition Of Air In The Atmosphere
- Draw Diagram The Atmosphere
- Atmosphere air composition | Water cycle diagram | Percentage Pie ...
- Percentage Pie Chart . Pie Chart Examples | Atmosphere air ...
- Draw A Pie Chart Showing Different Gases And Their Percentage In
- Diagram Of Atmospheric Air
- Atmosphere air composition | Basic Pie Charts | Fishbone Diagram ...
- Greenhouse Effect Best Diagram For Draw
- Atmosphere air composition | Air Composition Pie Chart
- ERD | Entity Relationship Diagrams, ERD Software for Mac and Win
- Flowchart | Basic Flowchart Symbols and Meaning
- Flowchart | Flowchart Design - Symbols, Shapes, Stencils and Icons
- Flowchart | Flow Chart Symbols
- Electrical | Electrical Drawing - Wiring and Circuits Schematics
- Flowchart | Common Flowchart Symbols
- Flowchart | Common Flowchart Symbols